Navigating Corporate Filings

Information Extraction via (Seek)Edgar

Dr. Mingze Gao

Department of Applied Finance; Macquarie University FinTech and Banking Research Centre

2026-04-23

Why filings

A public archive of firm behaviour for every field

A single filing is at once a legal document, a financial report, a strategy narrative, and a text corpus. It speaks to every field.

Accounting & Governance
Footnotes, estimates, proxy disclosures, board structure, SOX 404, CD&A.

Actuarial & Analytics
XBRL facts, risk disclosures, insurance and fund filings, text-based analytics.

Applied Finance
Capital raising, contracts, ownership, event studies, insider trading, M&A.

Economics
Regulation as natural experiment, rule changes, industry dynamics, political economy.

Management
Strategy narratives, restructuring, leadership turnover, executive incentives.

Marketing
Customer concentration, product risk, brand incidents, consumer-facing language.

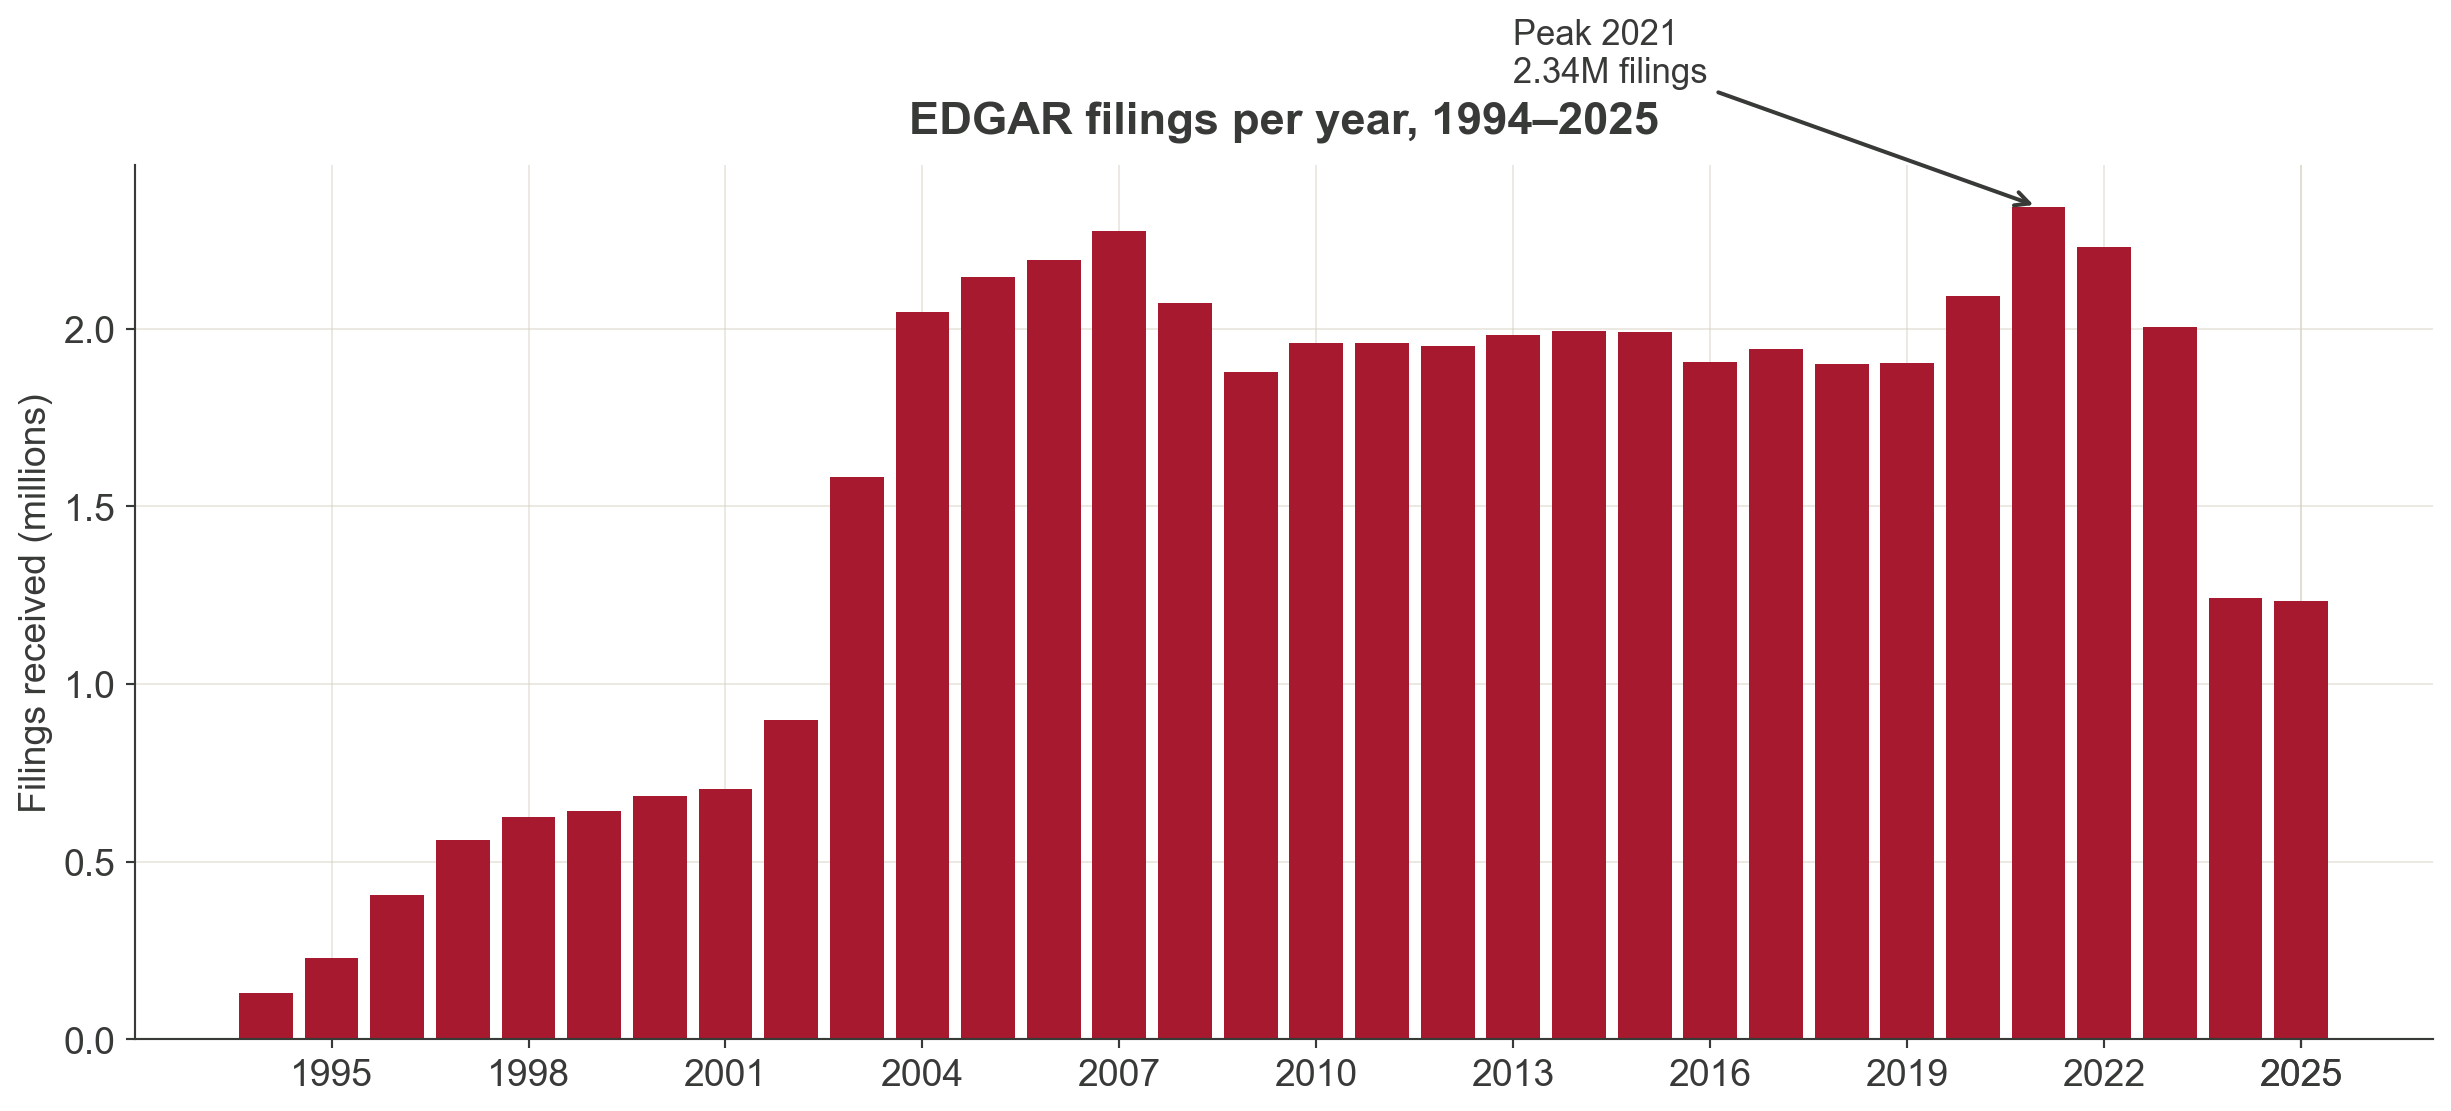
Three decades of growth

Figure 1: Filings received on EDGAR per calendar year, 1994–2025. Source: SEC EDGAR full-index.

49.7M+
filings, 1994–2025

~2M / year
since 2004

~8,000 / day
new filings on a typical business day

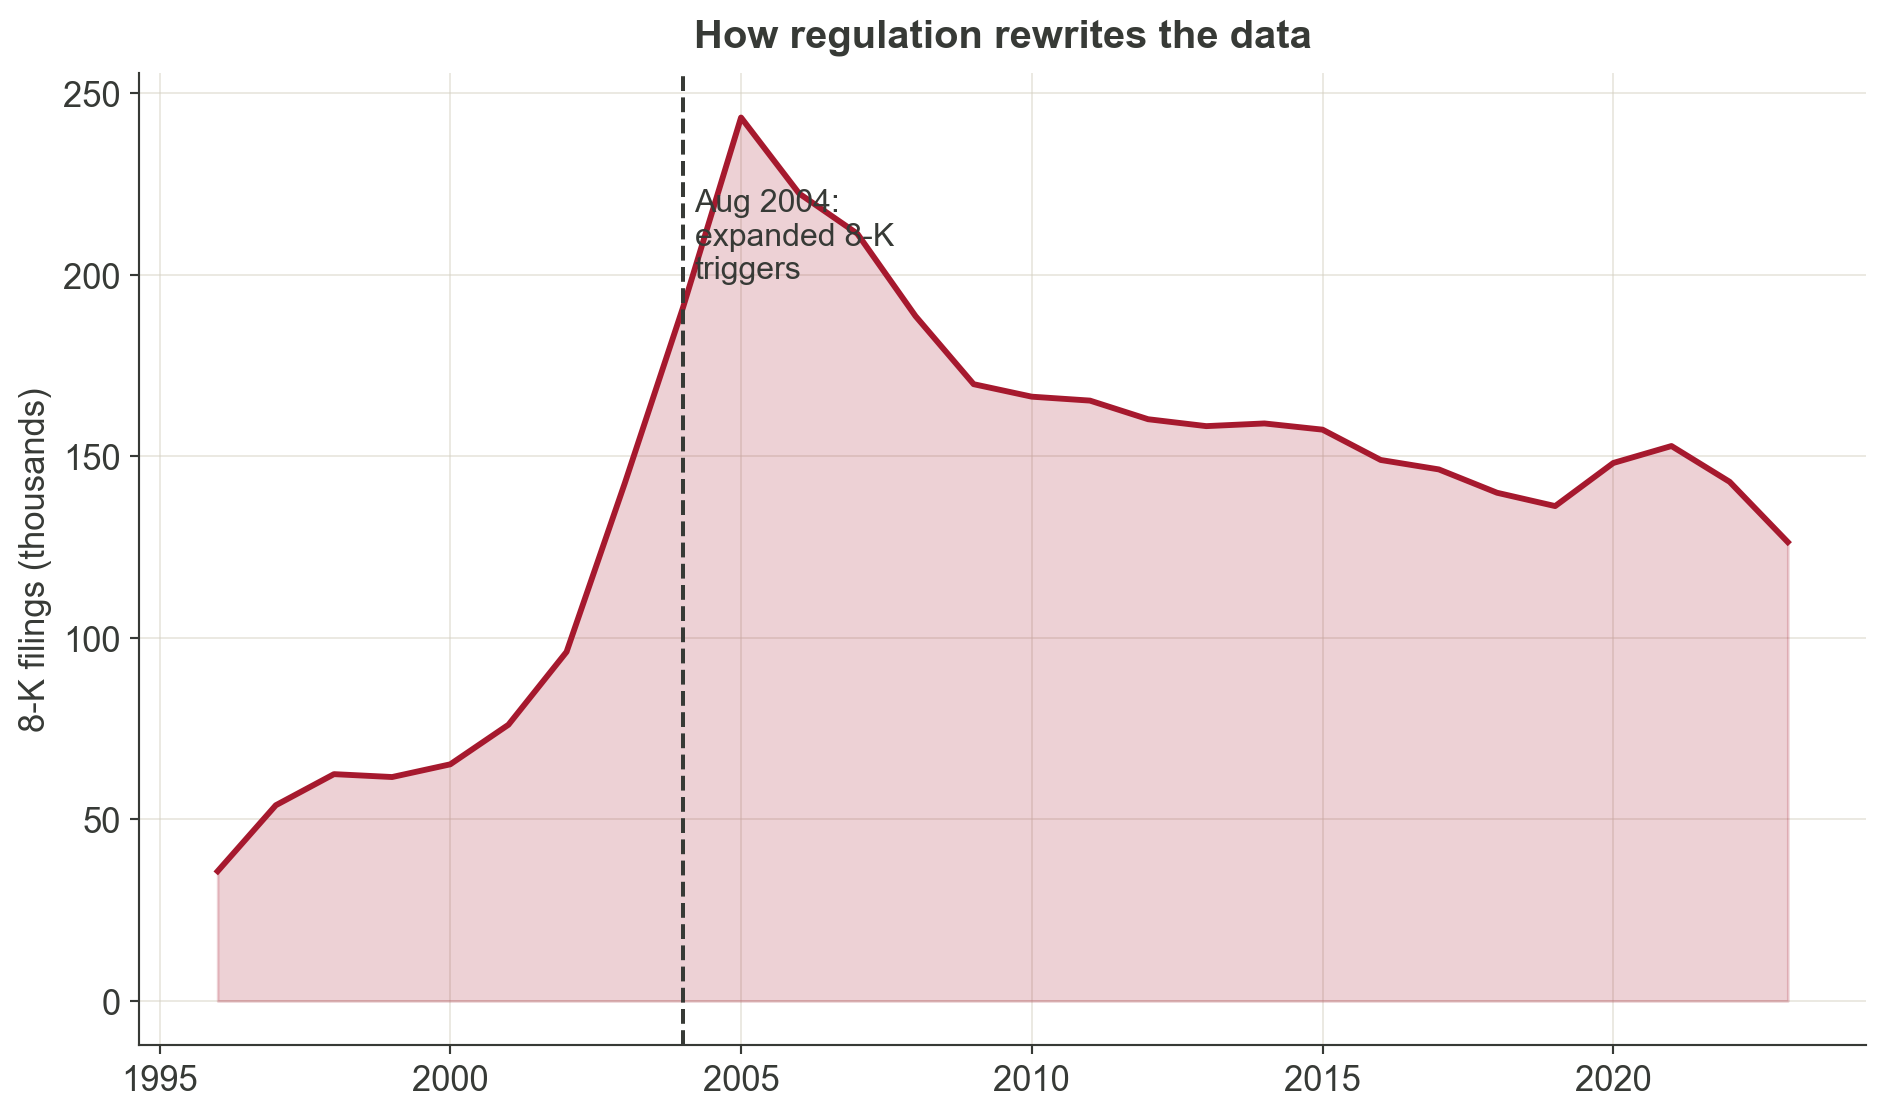
Regulation leaves fingerprints. The 2003–2004 step-up reflects expanded 8-K triggers and ownership-reporting rules.

Top forms by filing count

Figure 2: Top 15 form types on EDGAR by filing count, 1994–2025. Source: SEC EDGAR full-index.

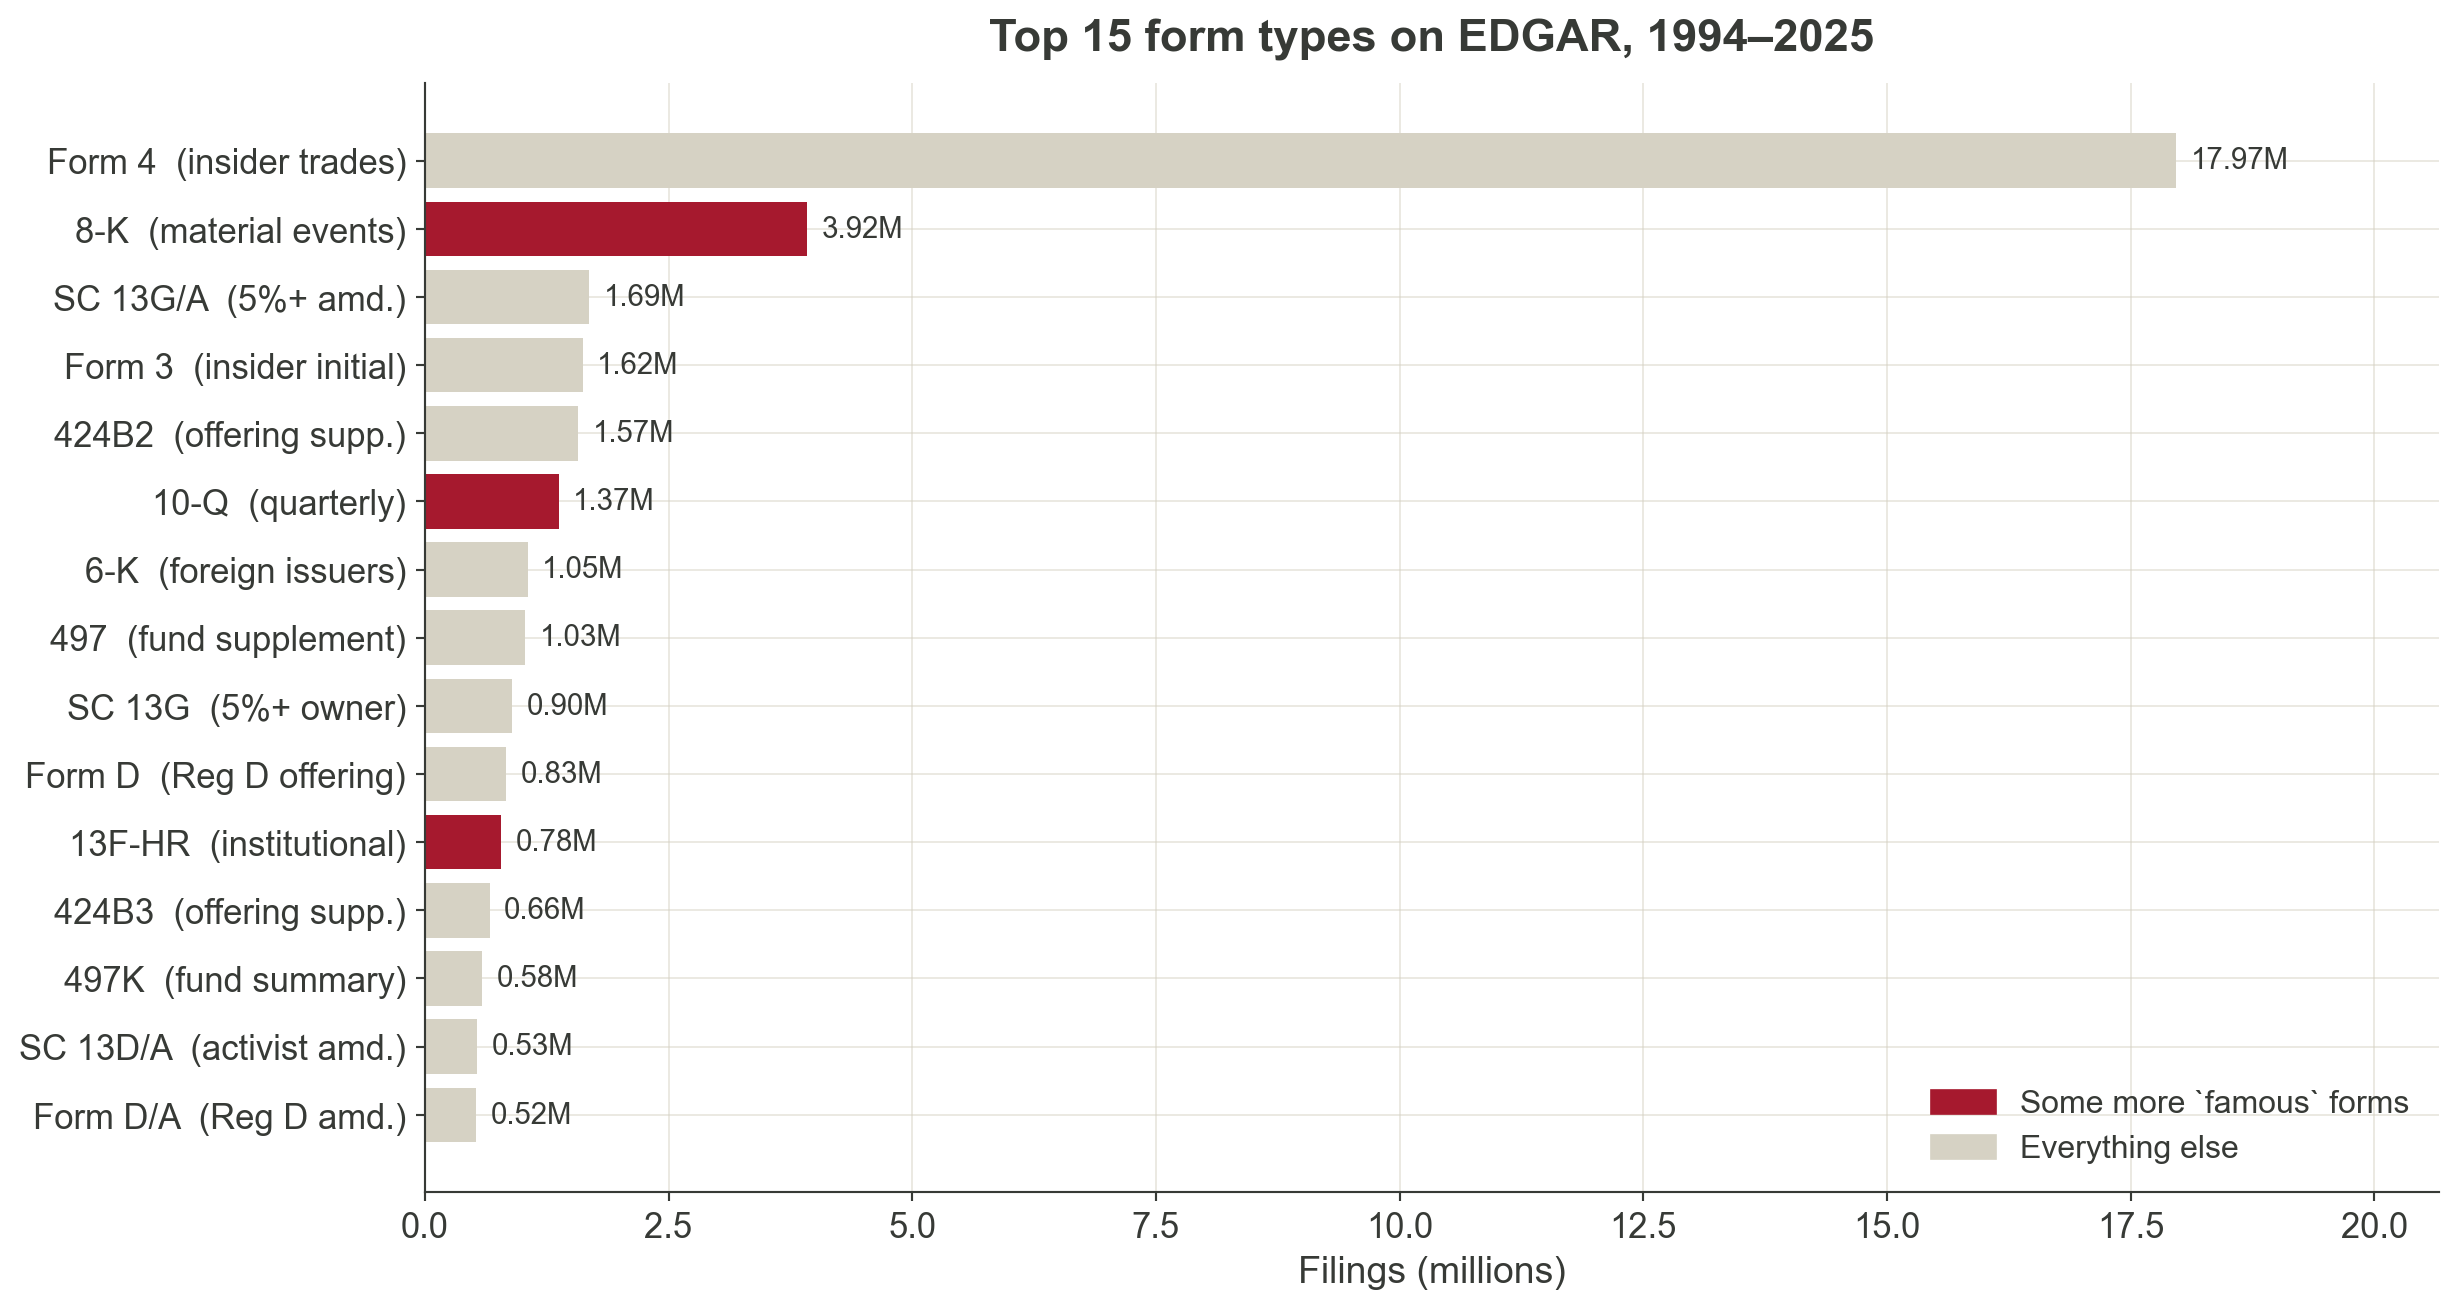
The most-filed form you probably haven’t heard of

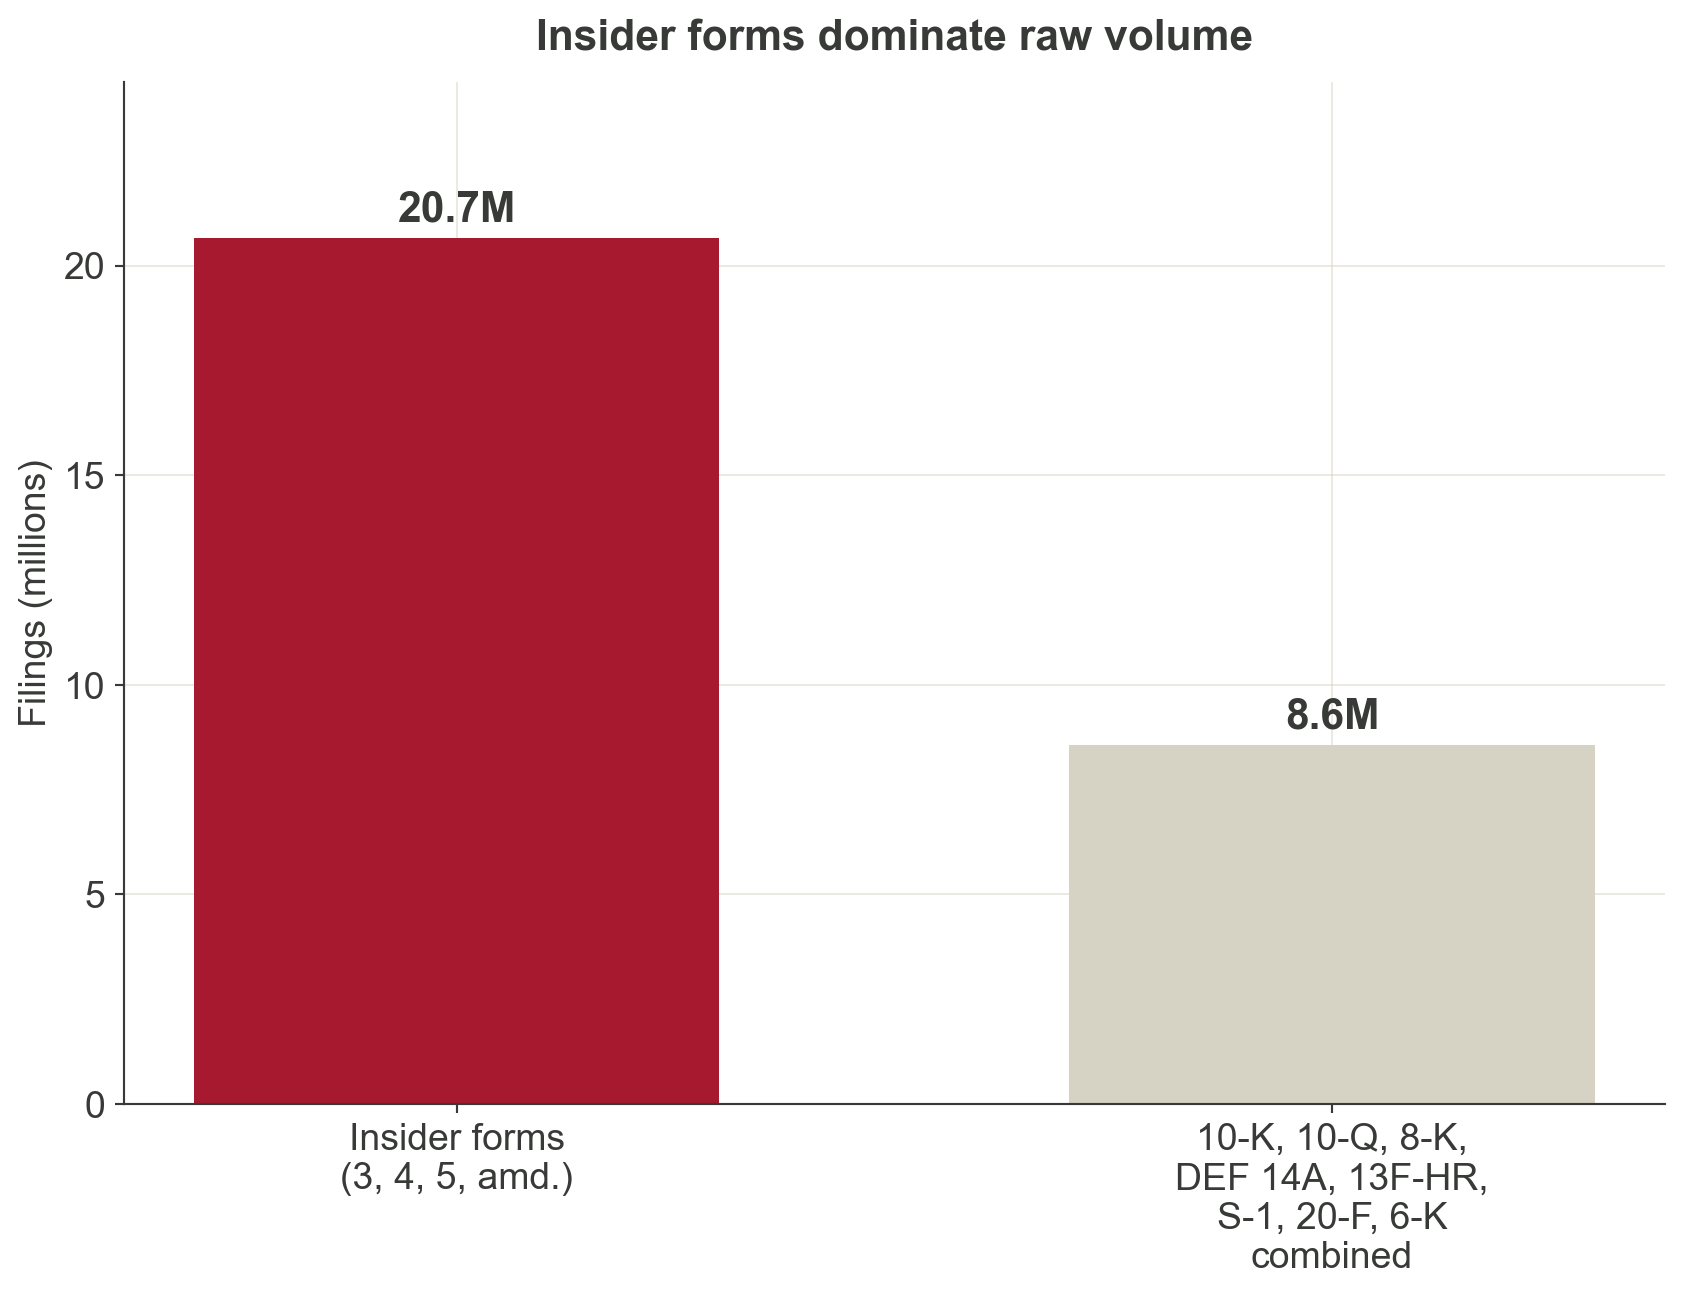
Form 4 is a one-page filing that an officer, director, or 10% shareholder submits within two business days of trading their company’s shares.

  • 17.9 million Form 4 filings since 1994.
  • More than 10-K, 10-Q, and 8-K combined.
  • Each filing reveals who traded, how much, at what price, when.

Research idea

Do insiders sell systematically before negative news? Do director purchases signal board confidence? Form 4 gives you the raw material.

Figure 3: Insider forms (3, 4, 5, amendments) vs. common research forms combined, 1994–2025.

Who files the most? (not who you think)

Figure 4: Top 15 filers on EDGAR by filing count, 1994–2025 (by CIK).

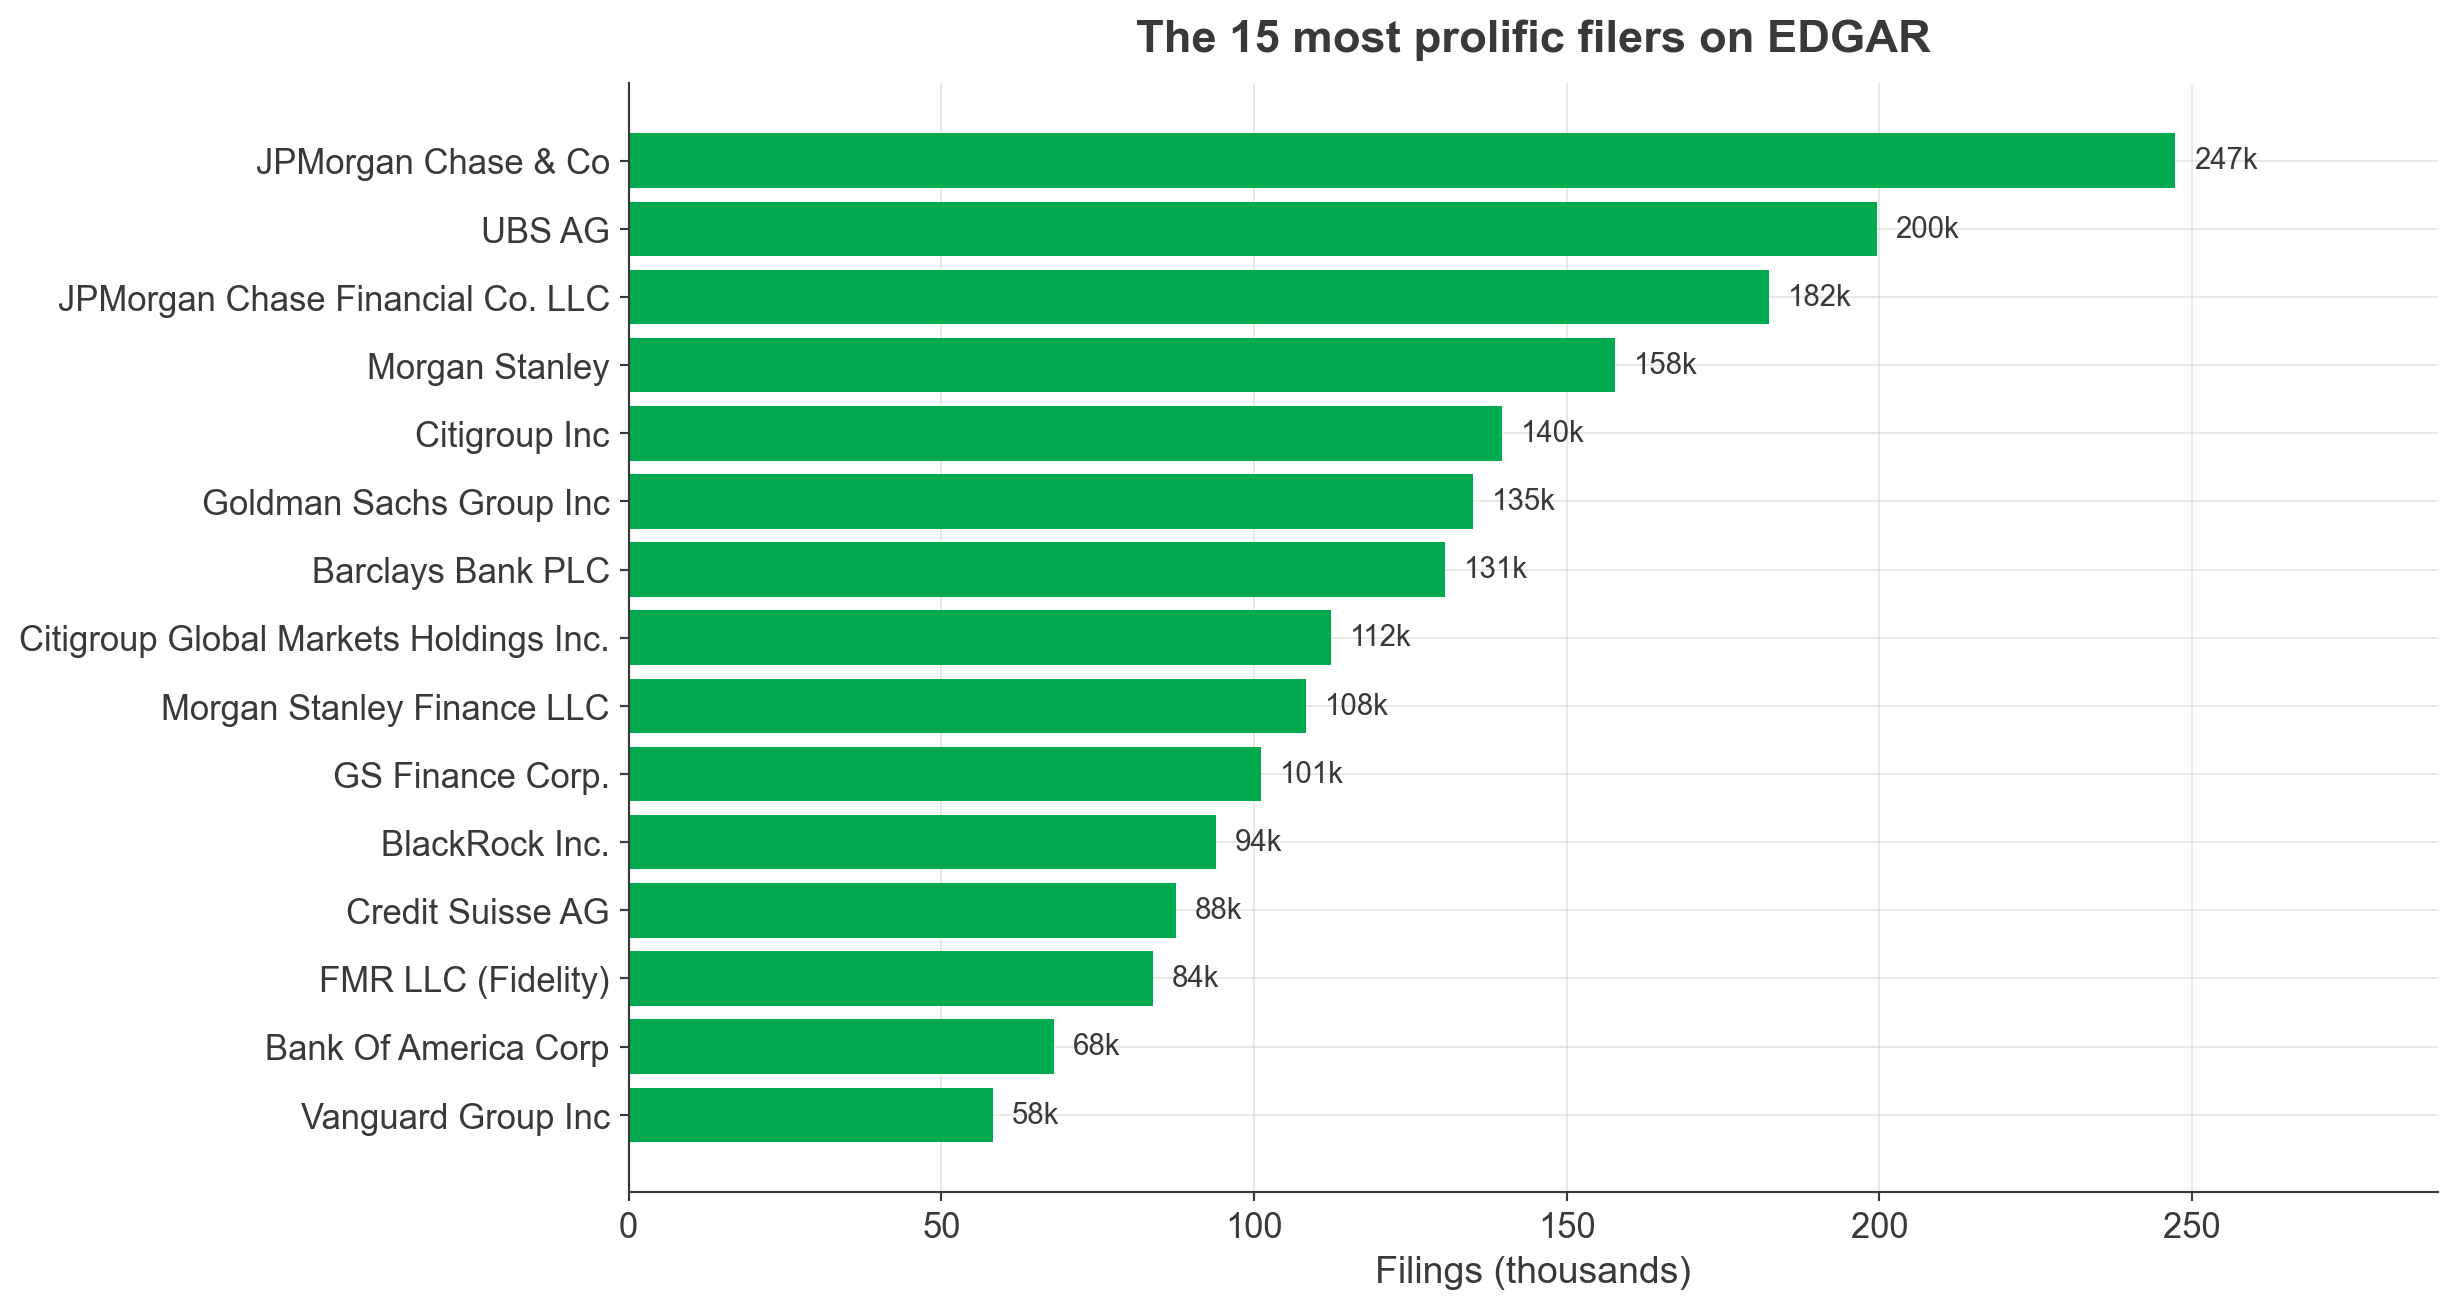
Not Apple. Not Tesla. The most prolific filers are investment banks, asset managers, and their structured-product issuing vehicles submitting thousands of offering supplements and ownership reports. The “firm” in your data is not always the “firm” in your theory.

What makes filings distinctive

Breadth

One archive covers listings, ownership, governance, material events, capital raising, deals, and contracts.

Longitudinal depth

Many firms have decades of filings, enabling within-firm designs.

Granularity

Items, sections, tables, XBRL tags, exhibits, signatures. Each layer supports a different empirical question.

Accountability

Disclosures are legally consequential. This is why they are often more careful, more consistent, and more comparable than press releases or pitch decks.

Filings are imperfect, strategic, and sometimes boilerplate. But those features can themselves become research objects.

1. The filing ecosystem

EDGAR in one slide

EDGAR: Electronic Data Gathering, Analysis, and Retrieval.

  • SEC’s primary electronic submission and public access system.
  • Includes company filings, individual ownership filings, fund filings, exhibits, and metadata.
  • Public access through web search, company pages, full-text search, and APIs.

Filers

EDGAR

Researchers

Investors

Regulators

Journalists

A map of the filing universe

Stop thinking in form codes. Think in research use.

Periodic reporting

  • 10-K, 10-Q, 20-F, 40-F

Event disclosure

  • 8-K, 6-K

Ownership and trading

  • 13D, 13G, 13F, Forms 3, 4, 5

Governance and shareholder process

  • DEF 14A, DEFA14A, PRE 14A

Capital raising and listing

  • S-1, F-1, S-3, prospectuses

Deals and restructuring

  • S-4, merger proxy, tender offers

Exhibits

  • EX-10 credit agreements, EX-2 merger agreements, employment contracts, charters, bylaws

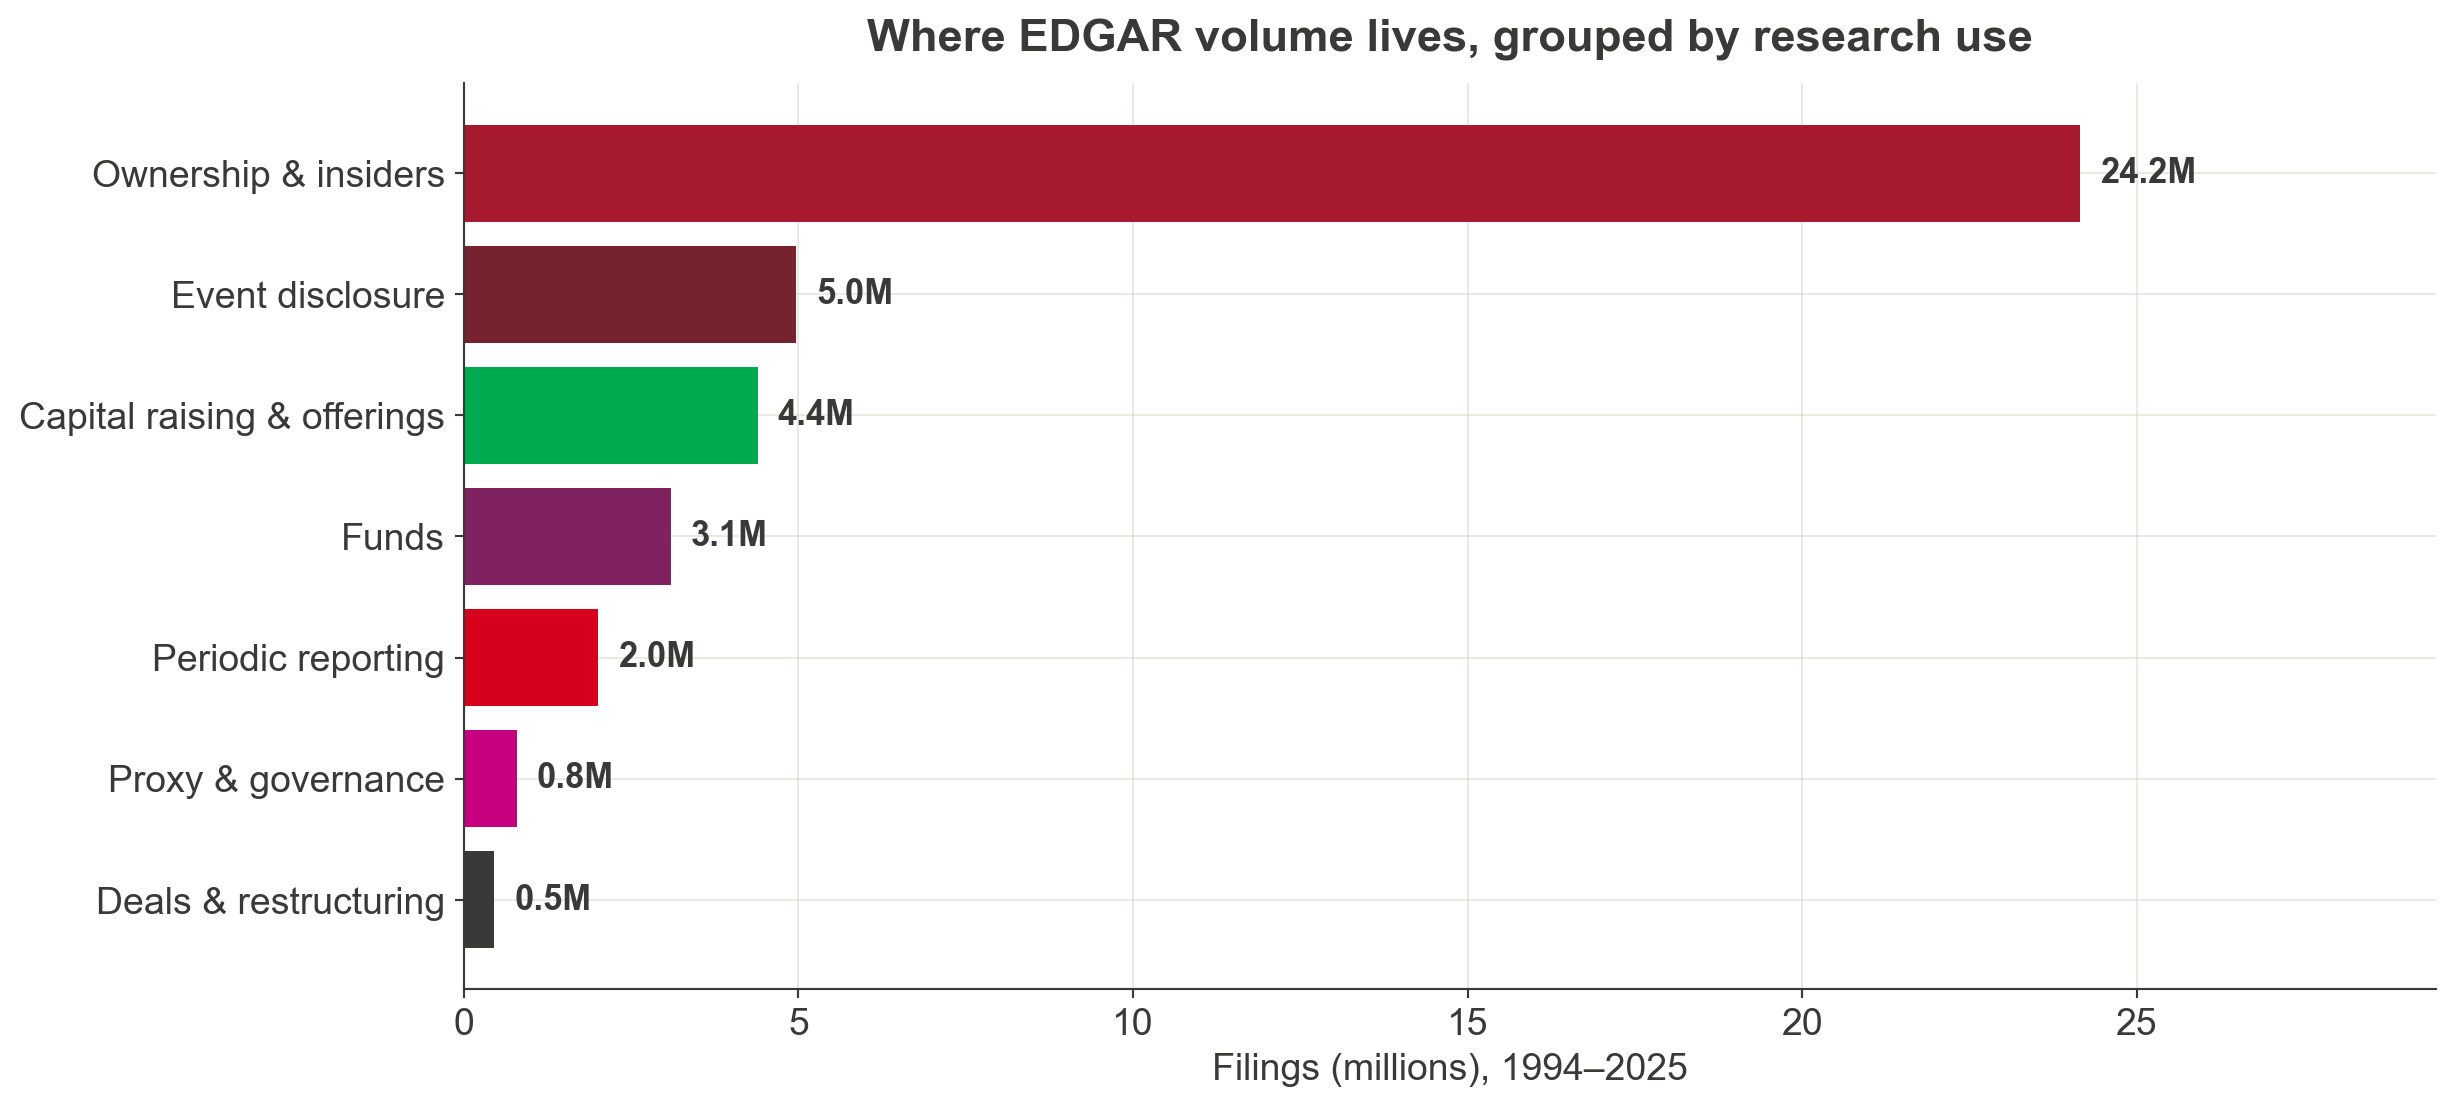
Filings grouped by research use

Figure 5: Filing volume by research-use category, 1994–2023. Mapping is illustrative, not official.

Periodic reports

The recurring narrative of the firm.

10-K (annual):

  • Business description, risk factors, MD&A.
  • Audited financial statements and footnotes.
  • Segment and geographic discussion.
  • Controls, legal proceedings, management certification.

10-Q (quarterly):

  • Condensed financials and MD&A update.
  • Updated risk factors and legal proceedings.
  • Interim-period events between 10-Ks.

Things researchers have measured from 10-K / 10-Q:

  • Cybersecurity and AI risk language.
  • Customer concentration and supply-chain exposure.
  • Climate disclosures and accounting estimates.
  • Year-on-year and quarter-on-quarter text changes.
Figure 6: When 10-Ks land: monthly 10-K filings, 1994–2025.

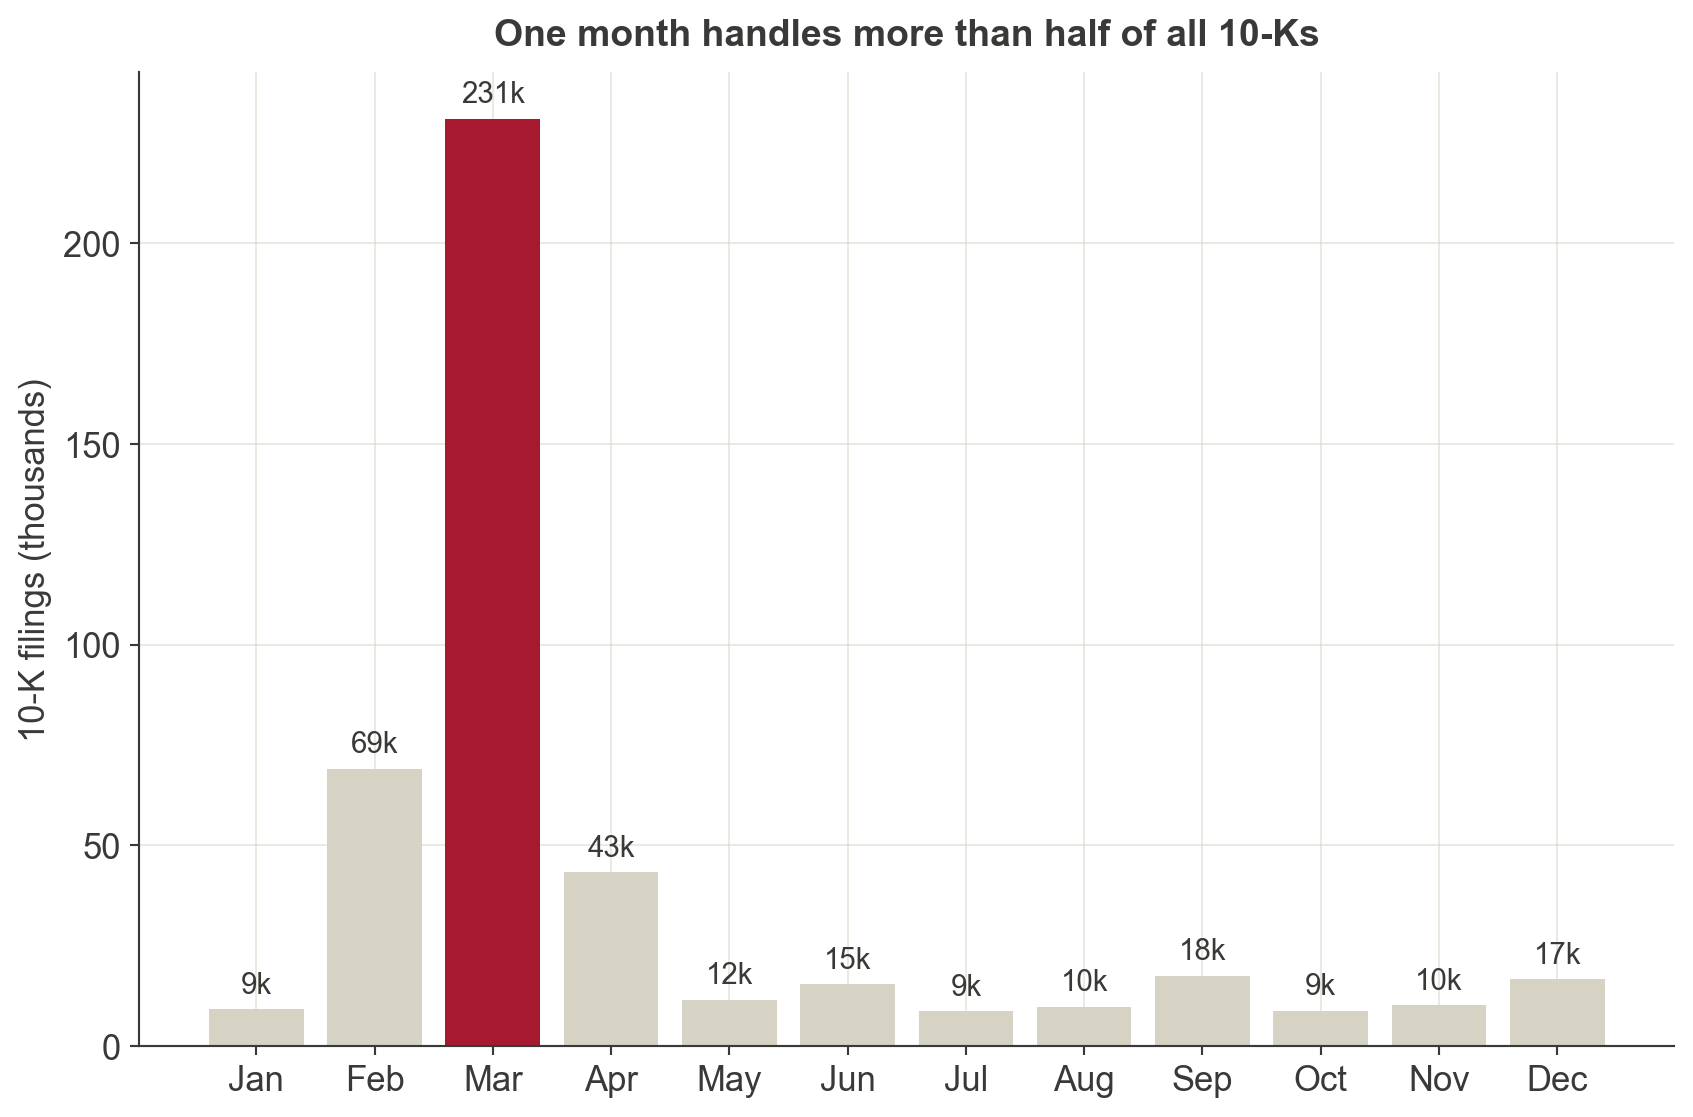
Most U.S. firms have a December fiscal year-end. Large filers must submit their 10-K within 60 days, others within 75–90 days. The calendar shapes the data.

Event-driven filings

When something material happens.

8-K can report:

  • Material agreements, impairments, restatements.
  • Leadership changes, auditor changes.
  • Results announcements, financing events, acquisitions.

6-K transmits material information disclosed by foreign issuers abroad.

Research idea

Event filings give you both the event and a dated disclosure text around it. Natural fit for event studies, difference-in-differences, and text-based treatment measures. See Lerman and Livnat (2010) for the 2004 8-K rule change and Florackis et al. (2023) for a modern cyber-risk example.

Figure 7: 8-K filings per year. The 2004 rule change expanded the set of events requiring disclosure.

Ownership, trading, and influence

  • 13F: institutional holdings (quarterly).
  • 13D / 13G: beneficial ownership, activism, large stakes.
  • Forms 3, 4, 5: insider holdings and transactions.

Used to study:

  • Governance and monitoring.
  • Informed trading and insider behaviour.
  • Activism and investor coalitions.

13F has reporting thresholds and covers only certain managers and securities. Do not treat it as the complete institutional portfolio.

Proxies: boards, pay, voting

DEF 14A is a dense data source in itself.

Three panels inside one proxy:

  1. People: director background, independence, tenure.
  2. Pay: executive compensation tables and CD&A.
  3. Votes: proposals, say-on-pay, shareholder proposals.

Research idea

A single DEF 14A can yield director-level, executive-level, and proposal-level panels. Link these to outcomes in periodic filings to study governance mechanisms. The entire E-index literature (Bebchuk et al. 2009) started from proxy reading.

Registration statements

Firms telling their story to investors.

  • S-1, F-1: IPOs and foreign issuers.
  • S-3 and prospectuses: seasoned offerings.

Why this matters for research:

  • Rich textual information exists before public trading history.
  • Founder control, lock-ups, and risk narratives are disclosed here.
  • Useful for entrepreneurship, innovation, and capital-market research.
Figure 8: S-1 registration statements per year, 1995–2023. Each spike marks a capital-markets wave.

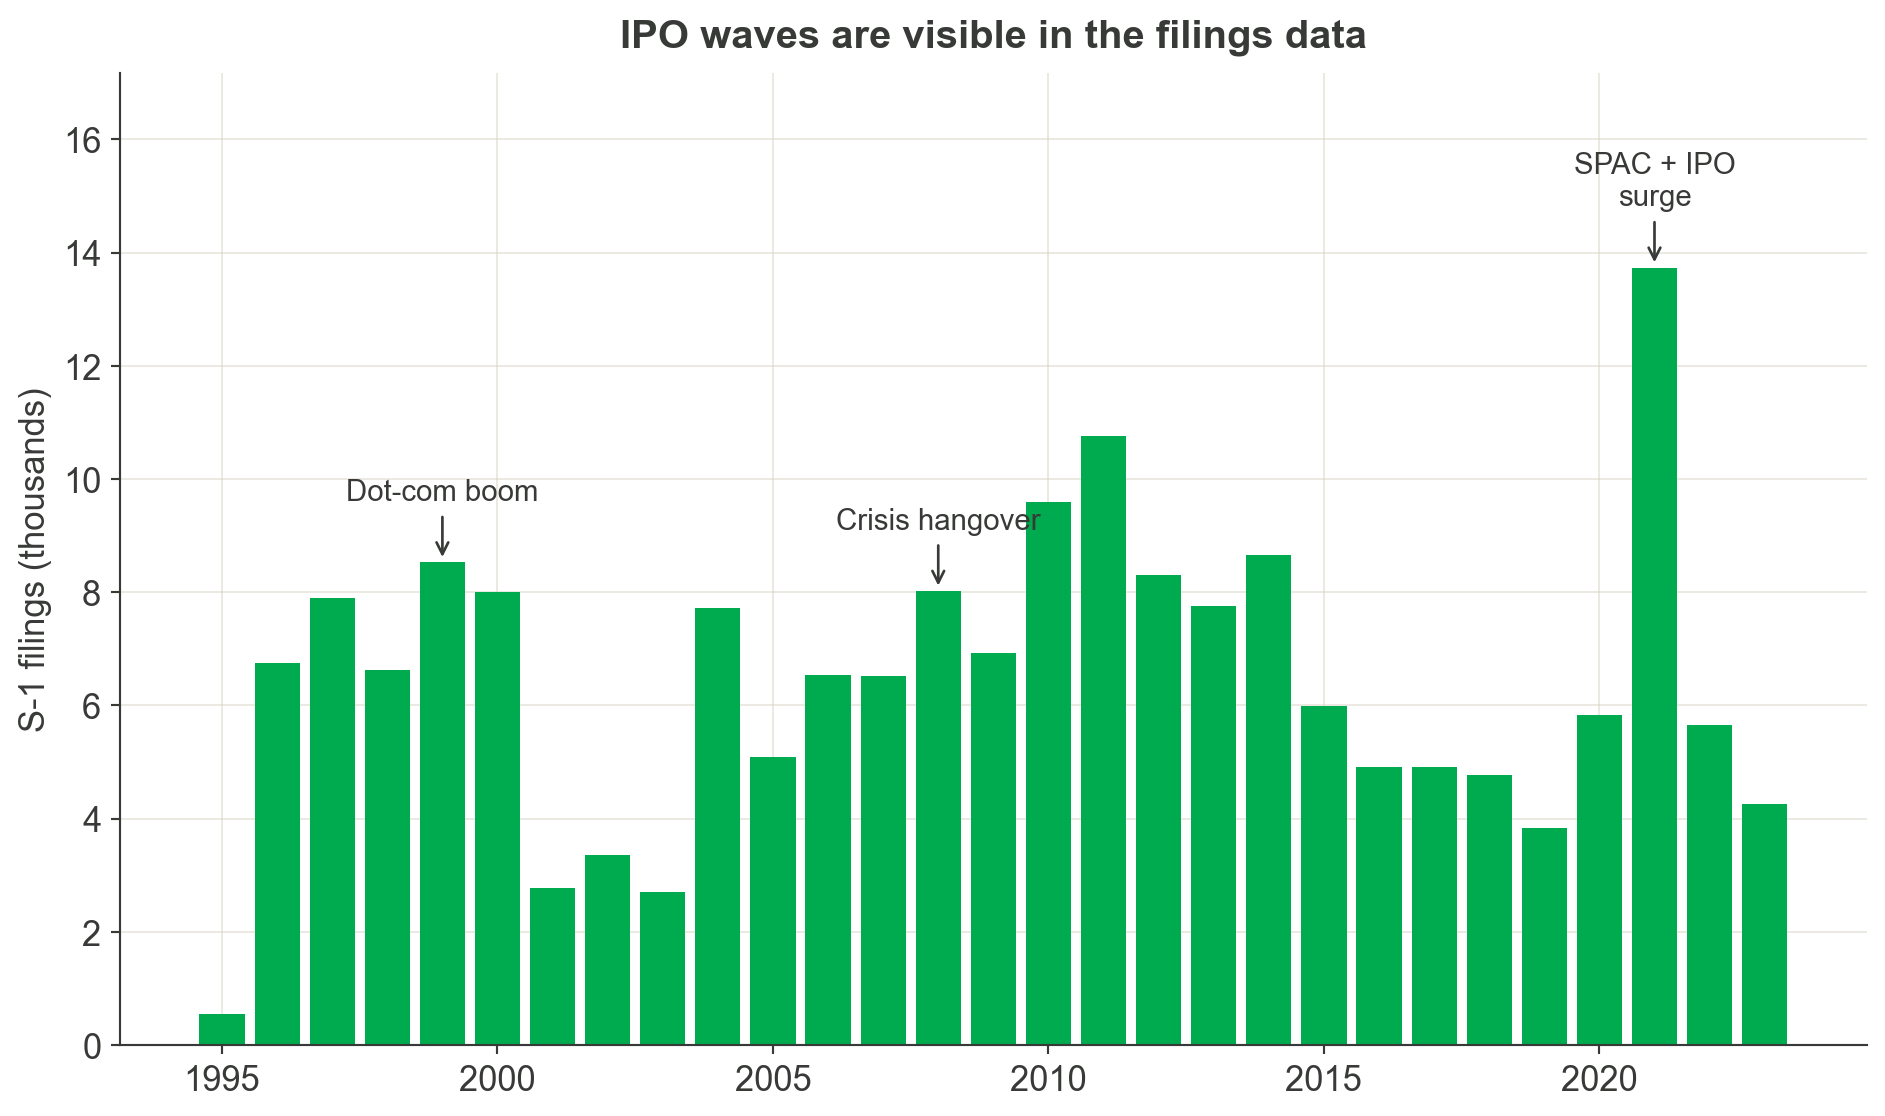
Market history is written in these filings. Dot-com (1999–2000), the post-crisis freeze (2008–2009), and the 2021 SPAC / IPO wave all show up as bumps in the S-1 series.

Exhibits are the hidden goldmine

Most students stop at the main filing. Much of the richest data is attached.

Exhibits can contain:

  • Credit agreements (EX-10) with covenants, pricing, collateral.
  • Acquisition agreements (EX-2) with representations and break fees.
  • Employment contracts with pay and severance structures.
  • Charters, bylaws, underwriting agreements, supply contracts.

For many research questions, the exhibit is the dataset.

2. What research can filings enable

Wave I: text as data

From readability to sentiment to firm networks.

Research ideas across MQBS departments

  • MGMT (10-K business sections): how do firms describe competitors, strategy, capabilities?
  • ASBA (10-K risk factors): turn risk-factor text into firm-level analytics and risk measures.
  • MKTG (MD&A): how do firms describe customers, channels, brand risk?
  • AFIN (S-1): how do IPO firms frame their story before trading history exists?

Example literature

  • Li (2008): harder-to-read 10-Ks predict lower earnings persistence. One variable from text, one result.
  • Loughran and McDonald (2011) built finance-tuned sentiment dictionaries after showing off-the-shelf tools misread filings. Now standard.
  • Hoberg and Phillips (2016) constructed text-based industry networks from 10-K product descriptions. Strategy, built entirely from filings.
  • Cohen et al. (2020) showed firms that change their 10-K language earn measurably different future returns.
  • Loughran and McDonald (2016) surveys the whole field.

Wave II: events as treatments

Dated disclosures support clean empirical designs.

Research ideas across MQBS departments

  • ACG (8-K item 4.02): do restatement announcements propagate to peers’ reporting choices?
  • AFIN (Form 4): do insider trades cluster before 8-K material events?
  • ECON (rule changes): how do firms respond when a new disclosure rule (climate, cyber, AI, human-capital) forces new language?
  • MGMT (S-1 / S-1/A amendments): how do founders rewrite strategy and risk language between filing and pricing?

Example literature

  • Lerman and Livnat (2010): the SEC’s 2004 expansion of 8-K triggers changed what firms disclose and how markets respond. Rule change as natural experiment.
  • Amir et al. (2018) used disclosure gaps to ask whether firms underreport cyber-attacks. Absence of disclosure is itself a variable.
  • Florackis et al. (2023) built a firm-level cyber-risk measure from 10-K risk factors and linked it to returns.
  • Brav et al. (2008) used the Schedule 13D filing as the event stamp for hedge-fund activism.

Wave III: ownership and influence

Who holds, who trades, who votes.

Research ideas across MQBS departments

  • MGMT (13F holdings): how do institutional holders shape operating and HR decisions?
  • AFIN (SC 13D activism): how does activist pressure change acquisitions and divestitures?
  • ACG (Forms 3/4/5): do director purchases signal board confidence? Do officer sales precede bad news?
  • ASBA (post-IPO Forms 4 + S-1 lock-ups): model how founder and VC stakes evolve after listing.

Example literature

  • Brav et al. (2008): hedge-fund activism via 13D filings shifts governance and performance.
  • Bebchuk et al. (2009): six governance provisions (E-index) extracted from proxies predict firm value.
  • Edmans et al. (2013): stock liquidity shapes blockholder governance, measured from 13D-to-13G switches.
  • Edmans (2014) and Yermack (2010) survey the field.

Wave IV: new measures from filing text

Purpose-built firm-level variables that did not exist ten years ago.

Research ideas across MQBS departments

  • ECON (10-K risk factors): build firm-level geopolitical or sanctions-exposure measures.
  • MKTG (10-K Item 1 customer disclosures): turn customer concentration into a strategic-dependence variable.
  • ACG / AFIN (10-K, DEF 14A): construct transition-risk and physical-climate-risk indices.
  • MGMT (10-K human-capital disclosures, post-2020 rule): build a workforce-composition or turnover measure.

Example literature

  • Hassan et al. (2019) built firm-level political risk from earnings-call and filing text. Now used across economics, political economy, and strategy.
  • Sautner et al. (2023) built firm-level climate-change exposure measures, widely adopted in sustainability and finance research.
  • Babina et al. (2024) measured AI investment from filings and links to firm growth and product innovation.
  • Matsumura et al. (2014) showed carbon disclosures change firm value.
  • Patatoukas (2012) turned customer-concentration disclosures into a marketing / strategy variable.

Each of these measures did not exist before someone went into filings and built it. The next firm-level measure is waiting for someone in your cohort to construct it.

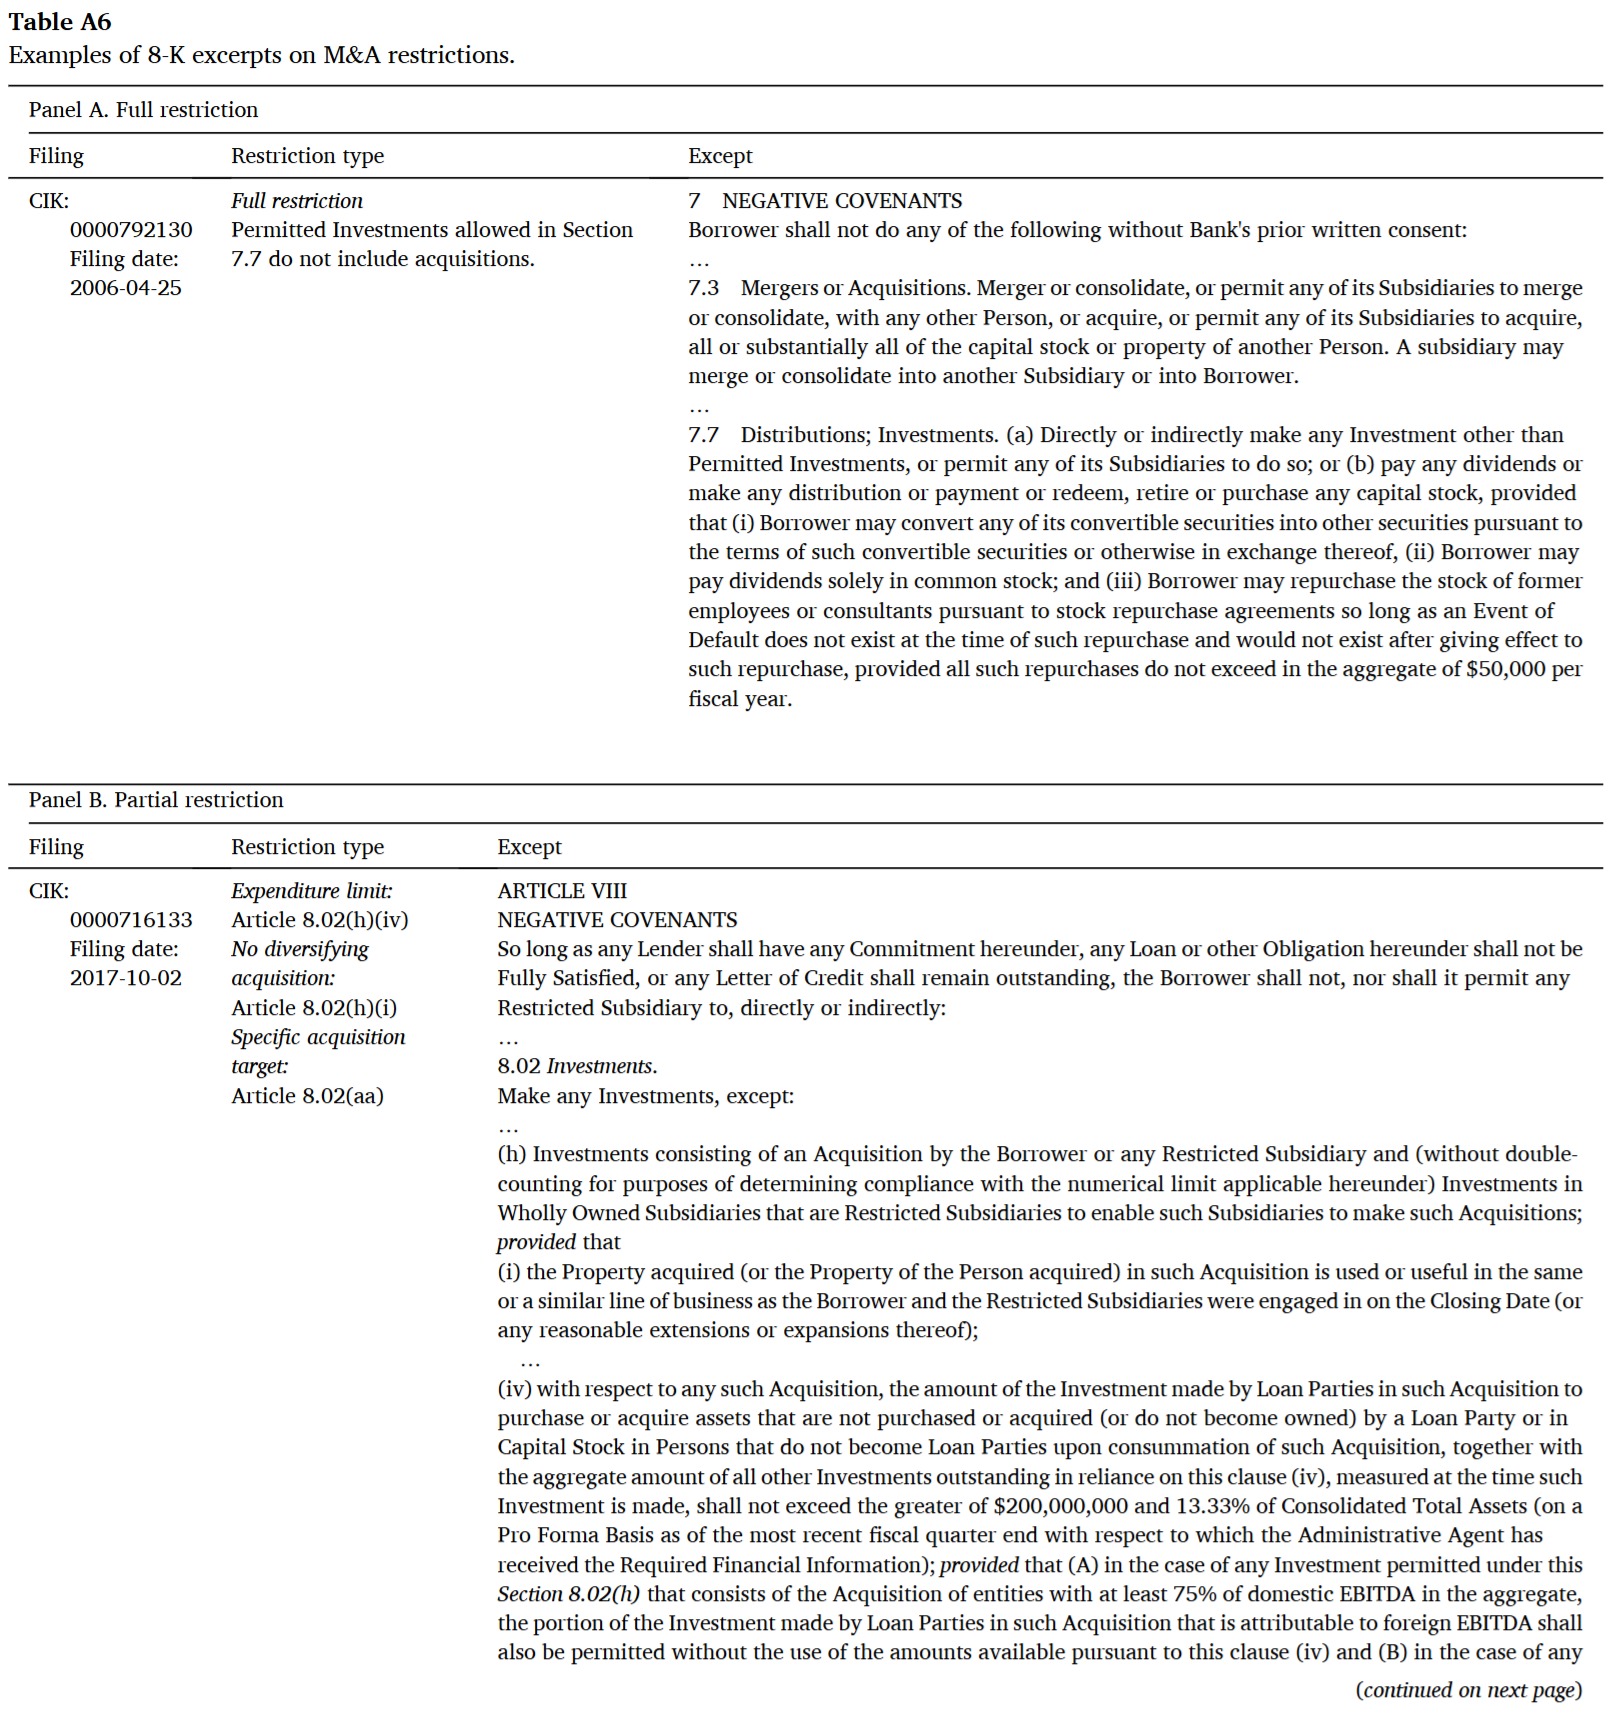
Case study: loan contracts in 8-K filings

  • Gao et al. (2026) studies how lenders restrict borrower M&A through covenants in syndicated loan contracts.
  • To examine the question, we need clause-level covenant data — the specific restrictions and exceptions that actually bind borrowers.
  • But this is not available anywhere. DealScan, WRDS, and Compustat record deal pricing and financial covenants, not acquisition-restriction clauses.
  • So we go to the raw filings: credit agreements are disclosed as EX-10 exhibits attached to 8-Ks, 10-Ks, and 10-Qs.
  • We hand-collect the exhibits from EDGAR, code acquisition-restriction covenants, and link to DealScan and SDC M&A deals.1
  • Contribution: prior work gave us a theory of lender screening and monitoring. We document the contractual mechanism — which clauses are written, when they bind, and how they change the M&A a borrower can pursue.2

Hand-coded acquisition-restriction covenants (Table A.6, Gao et al. (2026)).

Hand-coded acquisition-restriction covenants (Table A.6, Gao et al. (2026)).

3. From idea to data

The practical workflow

1. Define
construct
2. Identify
filing family
3. Manually
inspect
4. Extraction
protocol
5. Pilot &
validate
6. Scale
download
7. Link to
outcomes
8. Document
decisions

Do not automate before you understand what the relevant disclosure actually looks like.

The point of the pilot is not to build the final dataset. It is to prove that the signal exists and that you can recognise it reliably.

Filings have evolved: from plain text to structured data

The machine-readability of a filing depends heavily on when it was filed.

1993
EDGAR pilot
plain-text .txt
1996
EDGAR mandatory
all public U.S. issuers
2001
HTML permitted
formatting, tables
2005
Voluntary XBRL
structured tags
2009
XBRL mandated
large filers first
2011
All GAAP filers
XBRL required
2019
Inline XBRL
10-K / 10-Q
2022
iXBRL extended
funds & more forms

See the evolution in an Apple 10-K:

  • Plain-text era — pre-2000 10-Ks as .txt: no tables, no styling, just ASCII.
  • HTML era — pick a 2003–2008 10-K: real tables, still unstructured text.
  • Inline XBRL today — Apple’s 2024 10-K; hover any number to reveal its XBRL tag.

Why the format evolution matters for research

Data you can extract depends on the era

  • Pre-2001: text analytics only. Layout is lost; tables are hard.
  • 2001–2009: HTML parsing, table extraction.
  • 2009+: XBRL gives you firm-quarter-concept facts directly.
  • 2019+: iXBRL lets you pull the exact number that also appears on screen.

Coverage breaks at format boundaries

  • Long panels that cross 1996, 2009, or 2019 will have different measurement noise before and after each cutover.
  • Text-similarity papers often start their sample at 1996 for a reason.

Useful live resources

Full-text search covers only 2001 onward. For 1994–2000, you need to download and parse the raw text files.

Match the tool to the stage

Before any code, search with your eyes. Then scale with the right tool.

Stage Tool Why
Browse, learn the form EDGAR web Official, free, shows the actual layout
No-code pilot across many filings SeekEdgar Searches items, footnotes, MD&A, CD&A, SOX 404 — exports tables without writing code
Reproducible bulk download SEC APIs Submissions, companyfacts, XBRL frames — all JSON
Custom parsing at scale Python / R Full control, best when the construct is new or section-specific

Exploration and production are different jobs. Almost every filing project uses EDGAR + SeekEdgar for the pilot, then the APIs or Python for the final dataset.

SeekEdgar: a no-code layer on top of EDGAR

After the initial EDGAR full-text search, SeekEdgar helps you get a feel for the filings — section-aware search, snippet context, one-click export — without writing code.

  • Open the platform: seekedgar.com.
  • Restrict search to a specific section: 10-K risk factors, MD&A, DEF 14A CD&A, SOX 404, audit reports, footnotes.
  • Read ~20 snippets in context, refine keywords, then export to CSV / Excel for hand-validation.

Programmatic download, parsing, and analysis

When the pilot confirms the signal, move from clicks to code — SEC APIs for metadata and XBRL, plus raw filing downloads for narrative text.

  • Full walkthrough with runnable code: mingze-gao.com/posts/textual-analysis-on-sec-filings.
  • Covers: identifying filings via the SEC submissions API, building archive URLs, downloading primary documents, parsing sections, and basic textual analysis.
  • Works with Python; the same ideas port to R.

Start with a research question, not a form

  • What do firms do that is hard to observe elsewhere?
  • Which disclosure would be required to reveal it?
  • Can you validate the signal in twenty filings?
  • Can you scale it responsibly?

Corporate filings are not just documents to read. They are empirical traces of firm behaviour.

Takeaway

1

Broader than you thought

EDGAR is a universe of disclosure — not a 10-K repository.

2

Actually usable

Web search, APIs, and SeekEdgar lower the entry cost substantially.

3

Idea → dataset

A construct, a filing family, twenty filings, a validated protocol.

Appendix

A2. Common filing families

Family Examples Typical research use
Periodic reports 10-K, 10-Q, 20-F, 40-F Business, risks, financials, MD&A
Current reports 8-K, 6-K Events, agreements, management changes
Ownership 13D, 13G, 13F, Forms 3/4/5 Ownership, activism, insider trades
Proxy DEF 14A, PRE 14A Boards, pay, votes, proposals
Registration S-1, F-1, S-3 IPOs, offerings, narratives
Deals S-4, merger proxy, tender offers M&A, restructuring, control
Exhibits EX-2, EX-3, EX-10 Contracts, charters, material agreements

A3. A starter reading list

For students who want entry points into the literatures referenced in this talk.

Surveys (start here)

  • Loughran and McDonald (2016) on textual analysis.
  • Edmans (2014) on blockholders.
  • Yermack (2010) on shareholder voting.

Text as data

  • Li (2008), Loughran and McDonald (2011), Hoberg and Phillips (2016), Cohen et al. (2020).

Events and disclosure

  • Lerman and Livnat (2010), Amir et al. (2018), Florackis et al. (2023).

Ownership and governance

  • Brav et al. (2008), Bebchuk et al. (2009), Edmans et al. (2013).

Firm-level text measures

  • Hassan et al. (2019), Sautner et al. (2023), Babina et al. (2024), Matsumura et al. (2014).

Contracts and exhibits

  • Chava and Roberts (2008), Roberts and Sufi (2009), Nini et al. (2009), Nini et al. (2012), Gao et al. (2026).

Cross-discipline

  • Patatoukas (2012) (marketing / strategy), Bernstein (2015) (entrepreneurship).

References

Amir, Eli, Shai Levi, and Tsafrir Livne. 2018. “Do Firms Underreport Information on Cyber-Attacks? Evidence from Capital Markets.” Review of Accounting Studies 23 (3): 1177–206. https://doi.org/10.1007/s11142-018-9452-4.
Babina, Tania, Anastassia Fedyk, Alex He, and James Hodson. 2024. “Artificial Intelligence, Firm Growth, and Product Innovation.” Journal of Financial Economics 151: 103745. https://doi.org/10.1016/j.jfineco.2023.103745.
Bebchuk, Lucian, Alma Cohen, and Allen Ferrell. 2009. “What Matters in Corporate Governance?” Review of Financial Studies 22 (2): 783–827. https://doi.org/10.1093/rfs/hhn099.
Bernstein, Shai. 2015. “Does Going Public Affect Innovation?” Journal of Finance 70 (4): 1365–403. https://doi.org/10.1111/jofi.12275.
Brav, Alon, Wei Jiang, Frank Partnoy, and Randall Thomas. 2008. “Hedge Fund Activism, Corporate Governance, and Firm Performance.” Journal of Finance 63 (4): 1729–75. https://doi.org/10.1111/j.1540-6261.2008.01373.x.
Chava, Sudheer, and Michael R. Roberts. 2008. “How Does Financing Impact Investment? The Role of Debt Covenants.” Journal of Finance 63 (5): 2085–121. https://doi.org/10.1111/j.1540-6261.2008.01391.x.
Cohen, Lauren, Christopher Malloy, and Quoc Nguyen. 2020. “Lazy Prices.” Journal of Finance 75 (3): 1371–415. https://doi.org/10.1111/jofi.12885.
Edmans, Alex. 2014. “Blockholders and Corporate Governance.” Annual Review of Financial Economics 6: 23–50. https://doi.org/10.1146/annurev-financial-110613-034455.
Edmans, Alex, Vivian W. Fang, and Emanuel Zur. 2013. “The Effect of Liquidity on Governance.” Review of Financial Studies 26 (6): 1443–82. https://doi.org/10.1093/rfs/hht012.
Florackis, Chris, Christodoulos Louca, Roni Michaely, and Michael Weber. 2023. “Cybersecurity Risk.” Review of Financial Studies 36 (1): 351–407. https://doi.org/10.1093/rfs/hhac024.
Gao, Mingze, Thanh Son Luong, and Buhui Qiu. 2026. “Real Estate Collateral, Lender Screening, and M&A Performance.” Journal of Corporate Finance 98: 102962. https://doi.org/10.1016/j.jcorpfin.2026.102962.
Hassan, Tarek A., Stephan Hollander, Laurence van Lent, and Ahmed Tahoun. 2019. “Firm-Level Political Risk: Measurement and Effects.” Quarterly Journal of Economics 134 (4): 2135–202. https://doi.org/10.1093/qje/qjz021.
Hoberg, Gerard, and Gordon Phillips. 2016. “Text-Based Network Industries and Endogenous Product Differentiation.” Journal of Political Economy 124 (5): 1423–65. https://doi.org/10.1086/688176.
Lerman, Alina, and Joshua Livnat. 2010. “The New Form 8-K Disclosures.” Review of Accounting Studies 15 (4): 752–78. https://doi.org/10.1007/s11142-009-9114-7.
Li, Feng. 2008. “Annual Report Readability, Current Earnings, and Earnings Persistence.” Journal of Accounting and Economics 45 (2-3): 221–47. https://doi.org/10.1016/j.jacceco.2008.02.003.
Loughran, Tim, and Bill McDonald. 2011. “When Is a Liability Not a Liability? Textual Analysis, Dictionaries, and 10-Ks.” Journal of Finance 66 (1): 35–65. https://doi.org/10.1111/j.1540-6261.2010.01625.x.
Loughran, Tim, and Bill McDonald. 2016. “Textual Analysis in Accounting and Finance: A Survey.” Journal of Accounting Research 54 (4): 1187–230. https://doi.org/10.1111/1475-679X.12123.
Matsumura, Ella Mae, Rachna Prakash, and Sandra C. Vera-Muñoz. 2014. “Firm-Value Effects of Carbon Emissions and Carbon Disclosures.” The Accounting Review 89 (2): 695–724. https://doi.org/10.2308/accr-50629.
Nini, Greg, David C. Smith, and Amir Sufi. 2009. “Creditor Control Rights and Firm Investment Policy.” Journal of Financial Economics 92 (3): 400–420. https://doi.org/10.1016/j.jfineco.2008.04.008.
Nini, Greg, David C. Smith, and Amir Sufi. 2012. “Creditor Control Rights, Corporate Governance, and Firm Value.” Review of Financial Studies 25 (6): 1713–61. https://doi.org/10.1093/rfs/hhs007.
Patatoukas, Panos N. 2012. “Customer-Base Concentration: Implications for Firm Performance and Capital Markets.” The Accounting Review 87 (2): 363–92. https://doi.org/10.2308/accr-10198.
Roberts, Michael R., and Amir Sufi. 2009. “Control Rights and Capital Structure: An Empirical Investigation.” Journal of Finance 64 (4): 1657–95. https://doi.org/10.1111/j.1540-6261.2009.01476.x.
Sautner, Zacharias, Laurence van Lent, Grigory Vilkov, and Ruishen Zhang. 2023. “Firm-Level Climate Change Exposure.” Journal of Finance 78 (3): 1449–98. https://doi.org/10.1111/jofi.13219.
Yermack, David. 2010. “Shareholder Voting and Corporate Governance.” Annual Review of Financial Economics 2: 103–25. https://doi.org/10.1146/annurev-financial-073009-104034.