Day-to-day, expected losses are covered by loan pricing, provisions and earnings; capital is the buffer that absorbs the unexpected losses that get through.
This week we study the last line of defence against them: capital.
What is capital? Economic, accounting and regulatory perspectives.
How capital absorbs losses: market value vs book value of equity.
The Basel Accords: from Basel I to Basel III.
The core skill this week: calculating risk-weighted assets (RWA) and the four capital ratios, on- and off-balance-sheet.
Buffers on top: capital conservation buffer, CCyB, and G-SIB surcharges.
Discussion
A bank funds itself with 95% deposits and 5% equity. A typical non-financial firm is closer to 40% debt, 60% equity. Why do banks run on so little capital, and why do regulators let them?
Defining “capital”
Understanding how capital safeguards a financial institution (FI) from insolvency risk requires a clear definition of capital. However, definitions vary significantly across different perspectives:
Economist’s Perspective: Economists define an FI’s capital, or owners’ equity, as the difference between the market values of its assets and liabilities, also known as net worth. This concept aligns with market value accounting.
Accounting Perspective: Accountants typically focus on book value, which is the historical cost of assets minus liabilities as recorded in financial statements.
Regulatory Perspective: Regulatory bodies have crafted definitions of capital that may diverge from economic net worth to prioritize financial stability. Regulatory capital requirements often rely on historical or book value accounting concepts.
Regulatory capital includes various tiers (e.g., Tier 1 and Tier 2) and is used to assess capital adequacy.
Capital of financial institutions (FIs)
The major functions of capital are
to absorb unanticipated losses to enable the FI to continue as a going-concern
to protect uninsured depositors, bondholders and creditors in case of insolvency and liquidation
to protect FI insurance funds and the taxpayer
to protect the FI owners against increases in insurance premiums
to partially fund the FI’s real investment activities
Why is capital important in a regulatory context? APRA’s explanation of capital
From a prudential regulator’s perspective, capital is a measure of the financial cushion available to an institution to absorb any unexpected losses it experiences in running its business. For a bank, such losses might include loans that default and are written off. Insurers might be hit by an unexpectedly high volume of claims in the wake of a major natural disaster.
Sufficient capital levels
inspire confidence in the FI
enable the FI to continue as a going concern even in difficult times
The #1 misconception: capital is NOT a pile of cash
“Banks must hold more capital” sounds like money locked in a vault, sitting idle. It isn’t. Capital is a funding source: the slice of the bank’s assets financed by shareholders rather than by depositors and other creditors. A bank with more capital can lend just as much. It simply funds those loans with more equity and fewer IOUs. Cash is an asset; capital sits on the other side of the balance sheet. Many public arguments about capital regulation rest on getting this wrong.
Capital and insolvency risk
Example of bank net worth (capital) absorbing losses
The marking-to-market method allows balance sheet values to reflect current rather than historic prices.
Consider the following market value balance sheet of an FI:
Table 1: Market-value-based balance sheet before loan losses
Assets ($m)
Amount
Liabilities ($m)
Amount
Securities
70
Deposits
85
Loans
30
Net worth
15
Total assets
100
Total liabilities + equity
100
In this example the FI is solvent on a market value basis.
Example of bank net worth (capital) absorbing losses
The marking-to-market method allows balance sheet values to reflect current rather than historic prices.
Consider a fall in the market value of loans to $10 (a fall of $20m).
Table 2: Market-value-based balance sheet after loan losses
Assets ($m)
Amount
Liabilities ($m)
Amount
Securities
70
Deposits
85
Loans
10
Net worth
-5
Total assets
80
Total liabilities + equity
80
FI is now insolvent, its net worth has declined from $15 to -$5. The owners’ net worth stake has been completely wiped out.
After the liquidation of the remaining $80 in assets, depositors would get only 80/85 in dollars, without deposit insurance.
The FI’s capital is used to absorb (partially) the losses.
The example also shows that market valuation of the balance sheet produces an economically accurate picture of the net worth and thus the solvency position of an FI.
The book value of capital
However, the FI’s balance sheet based on book value could remain unchanged.
Table 3: Book-value-based balance sheet after loan losses
With book value accounting, FIs have discretion in how and when they report loan losses on their balance sheets.
This flexibility allows them to strategically manage the recognition of these losses and their subsequent effect on capital.
For example, the FI could just record an increase in loan loss provisions to reflect their expected loan losses (e.g., $5m).
Table 4: Book-value-based balance sheet with loan loss provisions
Assets ($m)
Amount
Liabilities ($m)
Amount
Securities
70
Deposits
85
Loans
30
Net worth
10
less loan loss provisions
(5)
Total assets
95
Total liabilities + equity
95
Market-value vs book-value of equity
Obviously, market-value-based view of capital allows for a more accurate and comprehensive description of FIs’ financial health.
If regulators close an FI before its market value of capital reaches zero, liability holders will not lose.
But not all assets and liabilities are valued as fair value (market value).
Note
The Financial Accounting Standards Board (FASB) sets out Financial Accounting Standards (FAS) and the Generally Accepted Accounting Principles (GAAP), adopted in the U.S.
The International Accounting Standards Board (IASB) sets out the International Financial Reporting Standards (IFRS), adopted in many other places.
All trading assets, marketable securities (“available for sale”) are marked to market.
Loans and debt securities held for investment or to maturity are carried at amortized cost (book value).
Tip
Recall a bank’s banking book and trading book.
Real-world case: Silicon Valley Bank (SVB), March 2023
SVB held ~$91 billion in long-dated US Treasuries and mortgage-backed securities classified as held-to-maturity (HTM), so they were reported at amortised cost on the balance sheet, not market value. As interest rates surged over 2022 and 2023, the market value of those bonds fell by ~$15 billion. The book-value balance sheet showed nothing. When SVB was forced to sell some securities to raise cash, the $1.8 billion realised loss became visible and triggered a bank run. The bank collapsed in 48 hours.
Mark-to-market accounting would have signalled the problem long before the panic.
Why not market value for all?
Difficult to implement, especially for small banks, building societies and credit unions with large amounts of non-traded assets
Introduces unnecessary variability into an FI’s earnings
FIs are less willing to take long-term asset exposures such as commercial mortgages and business loans, since long-term assets are more interest rate sensitive.
Example balance sheet of a bank
Assets ($m)
Amount
Liabilities ($m)
Amount
Cash
20
Deposits
80
10-yr 5% corporate loans
100
Net worth
40
Total assets
120
Total liabilities + equity
120
Change in market conditions (like yield) can cause significant variation in bank’s capital value.
Code
viewof cash = Inputs.range( [0,100], {value:20,step:1,label:"Cash:"})viewof capital = Inputs.range( [0,100], {value:40,step:1,label:"Initial capital:"})d = {const c =0.05, m =10;const loan =100;const y =0.05;functionpv(c, f, t, r) {return c * (1- (1+r)**(-t)) / r + f / (1+r)**(t) }const prices = {"YTM": [],"Equity": []};let coupon = loan * c;let deposits =120- capital;for (let ytm =0.01; ytm <20; ytm++) {let mvloan =pv(coupon, loan, m, ytm/100);let dy = ytm - y*100; prices["YTM"].push(dy); prices["Equity"].push(cash + mvloan - deposits); }return prices;}Plot.plot({caption:"Assume current YTM of 5%.",x: {padding:0.4,label:"Change in YTM (%)"},grid:true,marks: [ Plot.ruleY([0]), Plot.ruleX([0]), Plot.lineY(transpose(d), {x:"YTM",y:"Equity",stroke:"blue"}), ]})
As a result, market value accounting may interfere with FIs’ special functions as lenders and monitors and may even result in (or accentuate) a major credit crunch.
Capital management and regulation
In summary,
capital is useful to absorb losses and to mitigate insolvency risk;
regulators use book value accounting standards to determine the adequate capital requirements for FIs.
As a result, FI’s capital is guided by two key factors:
regulated capital adequacy requirements, and
the risk-return trade-offs.
Research note: is bank equity really ‘expensive’?
Bankers argue that higher capital requirements raise funding costs and choke lending. Admati and Hellwig (2013) disagree: under Modigliani and Miller (1958) logic, more equity makes a bank safer, so shareholders should demand a lower return, and the funding mix largely shouldn’t matter. On this view, “equity is expensive” mostly reflects tax advantages of debt and the implicit public subsidy of deposits, not a real social cost. The debate remains unresolved, and it sits behind every Basel number in this lecture.
Risk-based capital ratio
Who determines the capital requirements?
Actual capital ratios applied can be country-specific, determined by national regulators. However, the Basel Accords provide the global framework for these capital ratios.
Why does a global standard exist?
Before 1988, capital requirements were left entirely to national regulators, and the playing field was uneven. Japanese banks were expanding aggressively abroad while holding far less capital than US or European peers. Basel I was partly about ending that arbitrage. Each later accord followed the same pattern: a crisis exposed a gap, regulators patched it.
The Basel Committee on Banking Supervision (BCBS) of the BIS sets out the 1988 Basel Capital Accord.
Member countries of the BIS agreed and implemented the Basel Capital Accord (Basel I).
a minimum ratio of capital to risk-weighted assets of 8%.
A series of updates led to the Basel Accord of 2006 (Basel II)
Basel III: responding to the 2007-09 financial crisis.
Basel I
Two capital ratios:
Tier 1 Capital Ratio
Primarily composed of common equity, retained earnings, and disclosed reserves, less goodwill and other intangibles.
Calculation: Tier 1 Capital / Risk-Weighted Assets (RWA)
Minimum requirement: 4%
Total Capital Ratio
Minimum requirement: 8%
Features:
Basel I introduced the systematic measurement of capital adequacy through the use of risk-weighted assets.
Basel I utilized RWA to account for the varying risk levels of different asset classes, including both on-balance-sheet and off-balance-sheet exposures.
Criticisms:
Credit Risk Focus: Basel I primarily recognized credit risk in the calculation of risk-weighted assets. It did not initially incorporate market risk or operational risk, leading to criticisms that it did not fully address the spectrum of risks faced by banks.1
Basel II
Basel II comprised three pillars:
minimum capital requirements, which sought to develop and expand the standardised rules set out in the 1988 Accord
supervisory review of an institution’s capital adequacy and internal assessment process
effective use of disclosure as a lever to strengthen market discipline and encourage sound banking practices
The measurement of capital did not change markedly in Basel II.
The measurement of risk was significantly enhanced to include operational risk, some market risks in the banking book, and risks associated with securitisation.
Under Basel II, two options are allowed for banks to measure their credit risk:
Standardized approach. Similar to Basel I, but more risk-sensitive.
Internal ratings-based (IRB) approach. Banks can use their internal rating system or credit scoring models to assess their portfolios, subject to regulatory approval.
Three options are available for measuring operational risk:
basic indicator.
standardized approach.
advanced measurement approach.
GFC and Basel 2.5
The Global Financial Crisis (GFC) in 2007-09 revealed that Basel II was flawed. For example,
credit ratings of complex securities were conducted by private companies without regulatory supervision or review
Basel II capital adequacy formula was procyclical, meaning that the required capital was increasing as the crisis unfolded, making it even harder for banks during crisis
In response, Basel 2.5 was agreed in 2009 (implemented from end-2011 internationally; 2013 in the US) and Basel III was passed in 2010 (phased in between 2013 and 2019).1
Basel 2.5 updated capital requirements on market risk from banks’ trading activities.
Basel III
Basel III is broader in perspective than just a revision of capital, capital adequacy, risk measurement and supervision. It introduced macroprudential measures, targeting the protection of the whole financial system.
Three pillars similar to in Basel II, but with significant enhancements.
Improvements to both standardized and IRB approaches in calculating adequate capital.
Inclusion of new capital conservation buffer and countercyclical capital buffer to the minimum required capital level.
Introduction of two minimum standards for funding liquidity: liquidity coverage ratio and net stable funding ratio.1
Higher capital requirements for trading and derivative activities.
Enhanced bank governance.
Enhanced risk disclosure.
Anatomy of risk-based capital ratio
Under Basel III, depository institutions (DIs) calculate and monitor four capital ratios. Every risk-based capital ratio is the same fraction. Only the numerator changes, depending on which definition of capital we use. The denominator is always the same total RWA.
Common equity Tier 1 (CET1) risk-based capital ratio\[
\text{CET1 capital ratio} = \frac{\text{CET1 capital}}{\text{Risk-weighted assets}}
\tag{1}\]
Tier 1 risk-based capital ratio\[
\text{Tier 1 capital ratio} = \frac{\text{Tier 1 capital}}{\text{Risk-weighted assets}}
\tag{2}\]
Total risk-based capital ratio\[
\text{Total capital ratio} = \frac{\text{Total capital}}{\text{Risk-weighted assets}}
\tag{3}\]
The one exception is the fourth ratio, the Tier 1 leverage ratio: its denominator is total unweighted exposure, not RWA.
Approaches for credit risk
Since Basel II, two options are available for banks to measure credit risk for calculating capital requirements.
The standardized approach.
Used by smaller depository institutions.
The internal ratings-based (IRB) approach.
Used by large depository institutions.
US: about 20 of the largest banking institutions with consolidated assets of $250 billion or more.1 US regulators proposed ending the use of internal models for credit risk (the “Basel III Endgame”), but the proposal has been substantially scaled back and its final form remains uncertain as of 2026.
Australia: currently approved for use by 6 of the largest banks in Australia.
Scope: standardised here, IRB in your group assessment
Total RWA is the sum of the RWA for credit risk, market risk, and operational risk. This lecture computes only the credit-risk component, and only under the standardised approach (regulator-set risk weights). Banks with supervisory approval measure credit RWA using their own models instead, under the internal ratings-based (IRB) approach. Your group assessment uses IRB, and we will build the full IRB pipeline step by step in workshop.
Capital ratios of DIs in Australia
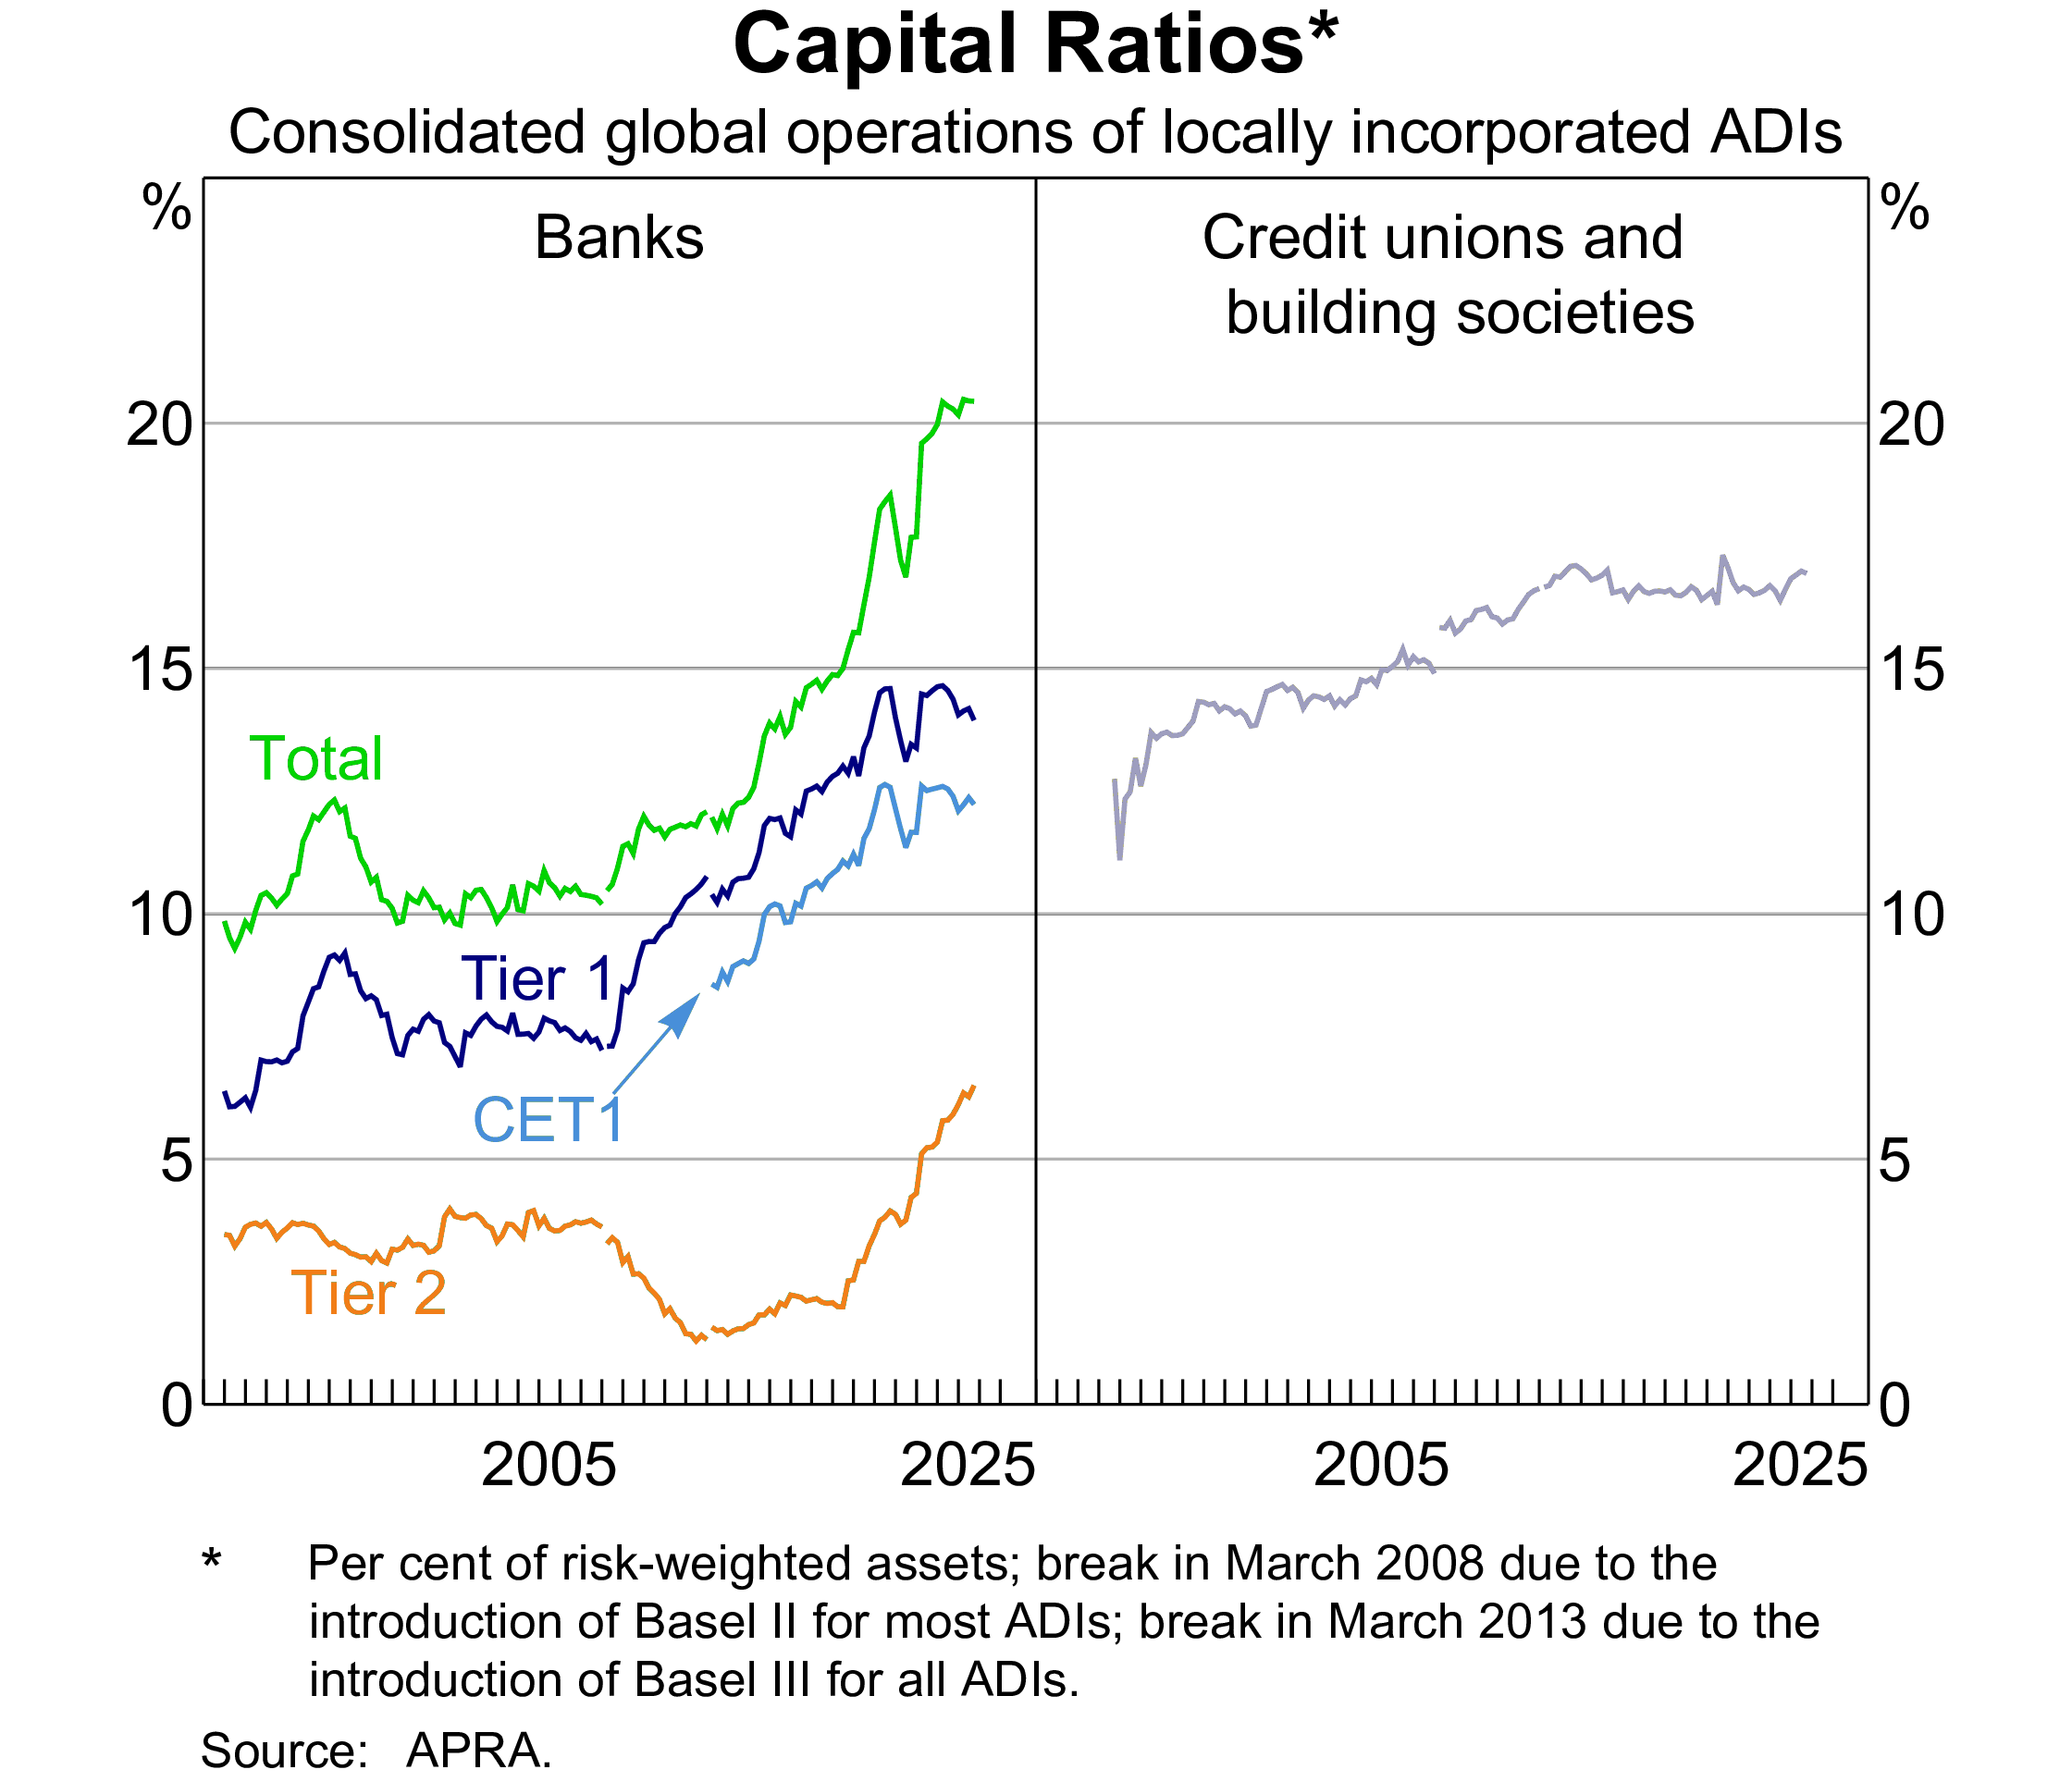
Figure 1: Capital ratios of DIs in Australia over time
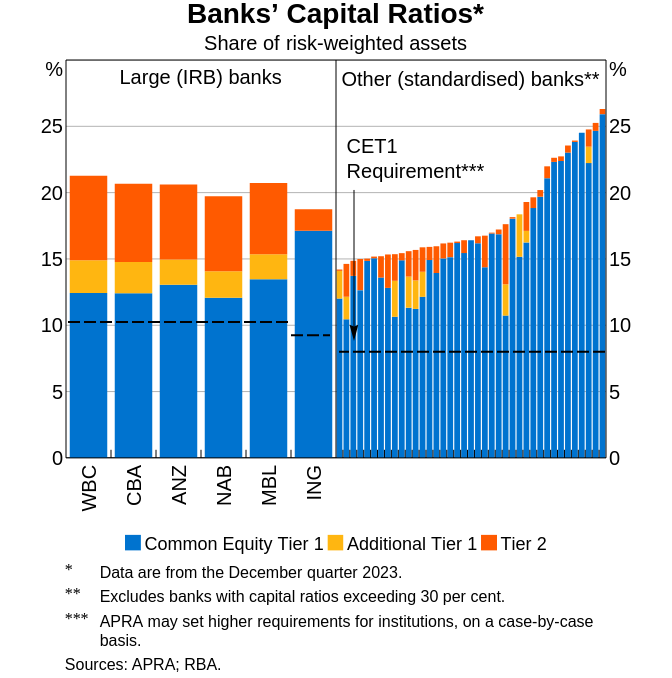
Figure 2: Capital ratios of DIs in Australia at December 2023
Type of capital: CET1 Capital
CET1 is the primary or core capital of a DI.
Common shares
Share premium resulting from the issue of CET1 instruments
Retained earnings
Accumulated and other comprehensive income (AOCI)
Other disclosed reserves
Certain minority interests
Regulatory adjustment applied in the calculation of CET1 Capital.
Type of capital: Tier 1 Capital
Tier 1 Capital is the sum of CET1 Capital and Additional Tier 1 Capital.
Additional Tier 1 Capital:
Instruments issued by a DI that qualify for Additional Tier 1 Capital and are not included in CET1 capital.
E.g., noncumulative perpetual preferred stock.
Certain Contingent Convertible Bonds (CoCos)
Share premium resulting from the issue of instruments included in Additional Tier 1 Capital.1
Tier 1 minority interest not included in CET1 capital.
Regulatory adjustments applied in the calculation of Additional Tier I Capital.
AT1 on trial: Credit Suisse, March 2023
How AT1 is designed to work. AT1 instruments are meant to absorb losses while the bank is still a going concern:
If the bank’s CET1 ratio falls below a pre-set trigger (at least 5.125% of RWA), the instrument converts to equity or is written down, recapitalising the bank while it still operates.
A “point of non-viability” clause additionally lets the regulator trigger the loss absorption if it judges the bank would otherwise fail.
How it actually went. The first full-scale test came with Credit Suisse. When UBS was orchestrated to take over the bank, Swiss regulator FINMA ordered ~CHF 16 billion (~US$17 billion) of Credit Suisse AT1 written down to zero. Three uncomfortable facts:
The write-down came only at the point of failure. AT1 never absorbed a franc of losses while Credit Suisse was a going concern.
Equity holders, who rank below AT1 in the capital stack, still received ~CHF 3 billion. The creditor hierarchy was inverted.
It was all legal. The instruments’ terms allowed exactly this in a resolution scenario; many investors discovered that clause only afterwards.
Bond markets were rattled worldwide, and regulators began asking whether AT1 delivers what it promises.
The verdict in Australia: AT1 abolished (a world first)
Credit Suisse showed AT1 absorbing losses too late: in resolution, not as a going concern.
In Australia, listed AT1 (“bank hybrids”) are held substantially by retail investors. Imposing losses on households mid-crisis would be slow, contested and politically fraught, exactly when speed matters most.
The transition:
Date
What happens
1 January 2027
AT1 no longer counts toward new capital requirements; the 1.5% AT1 requirement for large banks becomes 1.25% Tier 2 plus 0.25% CET1
The last AT1 recognition ends; Australian bank capital is, in effect, a two-tier system
Tip
Learn the three-tier structure anyway. It remains the global Basel standard and is what you will see in every international bank’s disclosures. The Australian phase-out is the twist on top, not a replacement for the framework.
Type of capital: Total Capital
Total Capital is the sum of Tier 1 and Tier 2 capitals, where Tier 2 Capital is supplementary capital.
Tier 2 Capital:
Instruments issued by a DI that qualify for Tier 2 Capital and are not included in Tier 1 capital.
Includes secondary “equity-like” capital resources, for example, loan loss reserves and some convertible and subordinated debt instruments.
Share premium resulting from the issue of instruments included in Tier 2 Capital.1
Tier 2 minority interest not included in Tier 1 capital.
Certain loan loss provisions.
Regulatory adjustments applied in the calculation of Tier 2 Capital.
Capital adequacy
Capital adequacy framework
Credit risk
The risk-based capital ratios as described earlier.
Interest rate risk
No formal add on yet.
Market risk
Additional capital charge.
Operational risk
Additional capital charge.
Minimum required capital adequacy ratios
The Basel III minimum ratios, the floors that every member jurisdiction agrees to impose (BIS, RBC20):
These are floors, not the rates banks in Australia actually face. National regulators are free to set more, and APRA does. The next two slides give the Australian numbers.
The minimums in Australia
APRA adopts the Basel minimums for the three risk-based ratios and goes further on leverage. Each number below is from the named source.
3.5% for IRB ADIs; 3.0% for standardised ADIs (APS 110)
So on the headline minimums, Australia matches Basel. The real Australian toughening sits in the buffers (capital conservation buffer of 3.75% for the majors and a 1.0% default CCyB), which we cover shortly under “unquestionably strong”.
The minimums change on 1 January 2027
The AT1 phase-out re-cuts the minimum ratios. What APRA has announced and finalised:
Large (IRB) banks: the 1.5% AT1 requirement is replaced by 1.25% Tier 2 plus 0.25% CET1. The overall CET1 requirement rises by 0.25 percentage points; the total amount of required capital is unchanged.
Smaller (standardised) banks: AT1 is replaced entirely with Tier 2, with a corresponding reduction in the Tier 1 requirement.
With AT1 gone, Tier 1 capital equals CET1, so the separate 6.0% Tier 1 minimum loses its meaning for Australian banks.
The leverage ratio for IRB ADIs is re-set from 3.5% to 3.25%, measured on a CET1 basis, to avoid an unintended tightening as AT1 drops out of the numerator.
The precise re-allocation between minimums and buffers is set out in the amended APS 110, which takes effect on 1 January 2027.
Note
For this course, work with the current framework (the table on the previous slide). Treat this slide as the forward-looking footnote: same total capital, different labels on the layers.
Overview of capital ratios calculation
Calculate the amount of capital (CET1, Tier 1, Total Capital).
Calculate the risk-weighted assets (RWA)1: sum of the amount of each asset multiplied by a risk weight specific to its riskiness.
On-balance-sheet:
Each asset has a risk weight
Multiply the asset by the corresponding risk weight
Off-balance-sheet:
Convert each asset to an on-balance-sheet equivalent
Multiply the equivalent exposure by the corresponding risk weight
Sum the on-balance-sheet and off-balance-sheet RWA
Calculate the capital ratios based on the amount of capital and RWA.
Capital ratios calculation: risk-weighted assets
Why weight assets at all? Because a dollar of Treasury bonds and a dollar of loans to a struggling company do not need the same equity behind them. Risk weights make the denominator reflect what could actually go wrong: the riskier the asset, the more capital it consumes.
We will use an example to showcase how to calculate risk-weighted assets.
Study tip
This worked example (on-balance-sheet RWA, then off-balance-sheet conversions, then the ratios) is the computational workhorse of this course.
Figure 1 and Figure 2 show the capital ratios of Australian banks.
Capital conservation buffer and countercyclical capital buffer (CCyB)
Basel III introduced two buffers, capital conservation buffer and countercyclical capital buffer, to the minimum required capital level.
Capital conservation buffer:
2.5% of risk weighted assets comprised of CET1 only
DI to hold minimum of 7% common equity Tier 1 (minimum of 4.5% plus conservation buffer of 2.5%)
If a DI’s capital conservation buffer falls below 2.5%, constraints are imposed on the DI’s distributions (e.g. dividends and bonuses)
CCyB:
May be declared by a country experiencing excess aggregate credit growth
Vary between 0 and 2.5% of risk-weighted assets comprised of CET1 only
If a DI’s CCyB falls below the set level, constraints are imposed on the DI’s distributions (e.g. dividends and bonuses)
Example
Suppose that a 2.5% capital conservation buffer currently applies and CCyB is 0, then the required CET1 capital ratio becomes 4.5%+2.5% = 7%.
If a bank’s CET1 capital ratio is 7.5%, it will receive no restrictions on its dividends payout, share buybacks, etc.
Example
Suppose that a 2.5% capital conservation buffer and a 1.5% CCyB currently apply, then the required CET1 capital ratio becomes 4.5%+2.5%+1.5% = 8.5%.
If a bank’s CET1 capital ratio is 7.5%, it will receive restrictions on its dividends payout, share buybacks, etc.
The Australian calibration: “unquestionably strong”
The Basel numbers above are the international floor. Since 1 January 2023, APRA’s capital framework sets tougher levels:
Component
Basel baseline
APRA (major IRB banks)
Minimum CET1
4.5%
4.5%
Capital conservation buffer
2.5%
3.75% (includes the D-SIB add-on)
Countercyclical buffer (default)
0%
1.0%
Effective CET1 requirement
7.0%
9.25%
The “unquestionably strong” benchmark dates from the 2014 Financial System Inquiry; APRA translated it into these calibrations.
Look back at Figure 1: the majors report CET1 around 12%, comfortably above 9.25%. Breaching a buffer means dividend restrictions, and markets punish a bank well before it gets that far.
Global Systemically Important Banks (G-SIBs)
Under Basel III, additional capital surcharge applies on Global Systemically Important Banks (G-SIBs).
1% to 3.5% in addition to the 7% minimum CET1 requirement (CET1 + capital conservation buffer).
A Bucket 1 G-SIB (1% surcharge) must hold at least 8% CET1 (= 4.5% + 2.5% + 1%) to avoid payment restrictions; higher buckets require more.
Total exposure is equal to the DI’s total assets plus off-balance-sheet exposure.
For derivative securities, off-balance-sheet exposure is current exposure plus potential future exposure as described earlier.
For off-balance-sheet credit (loan) commitments, a conversion factor of 100 percent is applied unless the commitments are immediately cancelable.
Risk-based capital: beyond credit risk
So far, the capital ratios (specifically, RWA) are calculated to account for the DI’s credit risk. However, a DI’s insolvency risk can also manifest from interest rate risk, market risk, operational risk, and more.
In Basel III, RWA should be the sum of three components:1
RWA for credit risk (covered in this lecture)
RWA for market risk. Can be calculated using two approaches:2
Standardized approach proposed by regulators. Revised standards (the “Fundamental Review of the Trading Book”, FRTB) published in 2016 and finalised in 2019 (more in Week 5).
DI’s internal market risk model subject to regulator approval. Move towards expected shortfall rather than value at risk (VaR).
RWA for operational risk. Some complicated calculation.3
Important
The RWA in the minimum capital ratios (Equation 5) is the sum of all three RWAs.
We covered only the RWA for credit risk.
Risk-based capital: beyond credit risk
In the previous example, we have calculated that the DI’s RWA (for credit risk) is $97.4 million.
Now, suppose that we have also calculated that the DI’s
RWA for market risk is $10.2 million, and
RWA for operational risk is $9 million.
The total RWA is $97.4 + $10.2 + $9 = $116.6 million.
In this course, no assessment will be on the calculation of RWA for market risk or RWA for operational risk.
RWA of Australian banks in 2023
Table 12: RWA of Australian banks in 2023 (source: Capital IQ)
CBA
Westpac
NAB
ANZ
Macquarie
RWA for credit risk
362,869
339,758
355,554
349,041
97,485
RWA for market risk
61,968
51,676
38,274
41,967
11,663
RWA for operational risk
43,155
55,175
41,178
42,319
15,828
Other RWA
0
4,809
0
0
0
Total RWA
467,992
451,418
435,006
433,327
124,976
RWA of Australian banks in 2024
Table 13: RWA of Australian banks in 2024 (source: Capital IQ)
CBA
Westpac
NAB
ANZ
Macquarie
RWA for credit risk
370,444
351,724
350,891
361,185
98,250
RWA for market risk
52,132
37,510
26,953
30,875
14,277
RWA for operational risk
44,975
48,196
36,102
49,650
17,512
Other RWA
0
0
0
4,872
0
Total RWA
467,551
437,430
413,946
446,582
130,039
Finally…
Key takeaways
Capital is the cushion that absorbs unexpected losses, and it is a funding source rather than a pile of idle cash. Whether a bank looks solvent can depend on the accounting: market value reveals problems that book value hides (SVB is the cautionary tale).
Basel evolution: Basel I introduced risk-weighted capital ratios; Basel II added the three pillars; Basel III added buffers, liquidity standards and macroprudential tools.
The four ratios: CET1 ≥ 4.5%, Tier 1 ≥ 6%, Total ≥ 8% (all over RWA), and Tier 1 leverage ≥ 3% (over total exposure, unweighted).
RWA is the engine: on-balance-sheet assets × risk weights, plus off-balance-sheet items converted via CCFs (and, for derivatives, potential + current exposure).
Buffers stack on top: capital conservation buffer (2.5%), CCyB (0 to 2.5%), and G-SIB surcharges (1 to 3.5%). Breach them and distributions are restricted. APRA sets tougher levels: an effective 9.25% CET1 requirement for the majors, which is why they report about 12%.
Australia is retiring AT1: from 1 January 2027 the framework shifts to CET1 plus Tier 2. The Credit Suisse write-down showed why regulators lost faith in hybrids.
Total RWA also includes market risk and operational risk components (not assessed in this unit’s calculations).
Admati and Hellwig (2013), an accessible case against the claim that bank equity is expensive
References
Admati, Anat, and Martin Hellwig. 2013. The Bankers’ New Clothes: What’s Wrong with Banking and What to Do about It. Princeton University Press.
Modigliani, F, and M H Miller. 1958. “The Cost of Capital, Corporation Finance and the Theory of Investment.”The American Economic Review 48 (3): 261–97.