AFIN8003 Week 10 - Sovereign Risk, Foreign Exchange Risk, and Off-Balance-Sheet Risk
Banking and Financial Intermediation
Dr. Mingze Gao and Dr. Lyungmae Choi
Department of Applied Finance
2026-10-15
Sovereign Risk, Foreign Exchange Risk, and Off-Balance-Sheet Risk
Losing money when everyone pays
A bank can lose money even when every borrower pays on time.
| Risk | What goes wrong | A story |
|---|---|---|
| Foreign exchange (FX) | The exchange rate moves | Black Wednesday, 1992: George Soros reportedly made about US$1 billion betting against the pound |
| Sovereign | A government stops the payment | Greece, 2015: capital controls trapped money inside the country |
| Off-balance-sheet (OBS) | A promise comes due | AIG, 2008: the US government committed up to US$182 billion to rescue it |
Roadmap
| Part | Focus |
|---|---|
| 1. FX risk | Currency positions, parity conditions, and hedging |
| 2. Sovereign risk | When the government, not the borrower, is the problem |
| 3. OBS risk | Promises that stay off the balance sheet until they are called |
The thread running through today
The usual way to hedge FX risk is a derivative, and a derivative is an off-balance-sheet contract. Parts 1 and 3 are two sides of the same toolkit.
Foreign exchange risk
Reading an exchange rate
An exchange rate is the price of one currency in terms of another.
- Australia quotes it as A$1 = US$0.72, often written AUD/USD 0.72.
- Flip it and US$1 = A$1.39.
- If AUD/USD rises to 0.75, the Australian dollar has strengthened: A$1 buys more US dollars.
Two kinds of trade:
- Spot: exchange currencies now, at today’s rate. Settles within two business days.
- Forward: agree a rate today, exchange the currencies on a set future date.
The Australian dollar since 2010
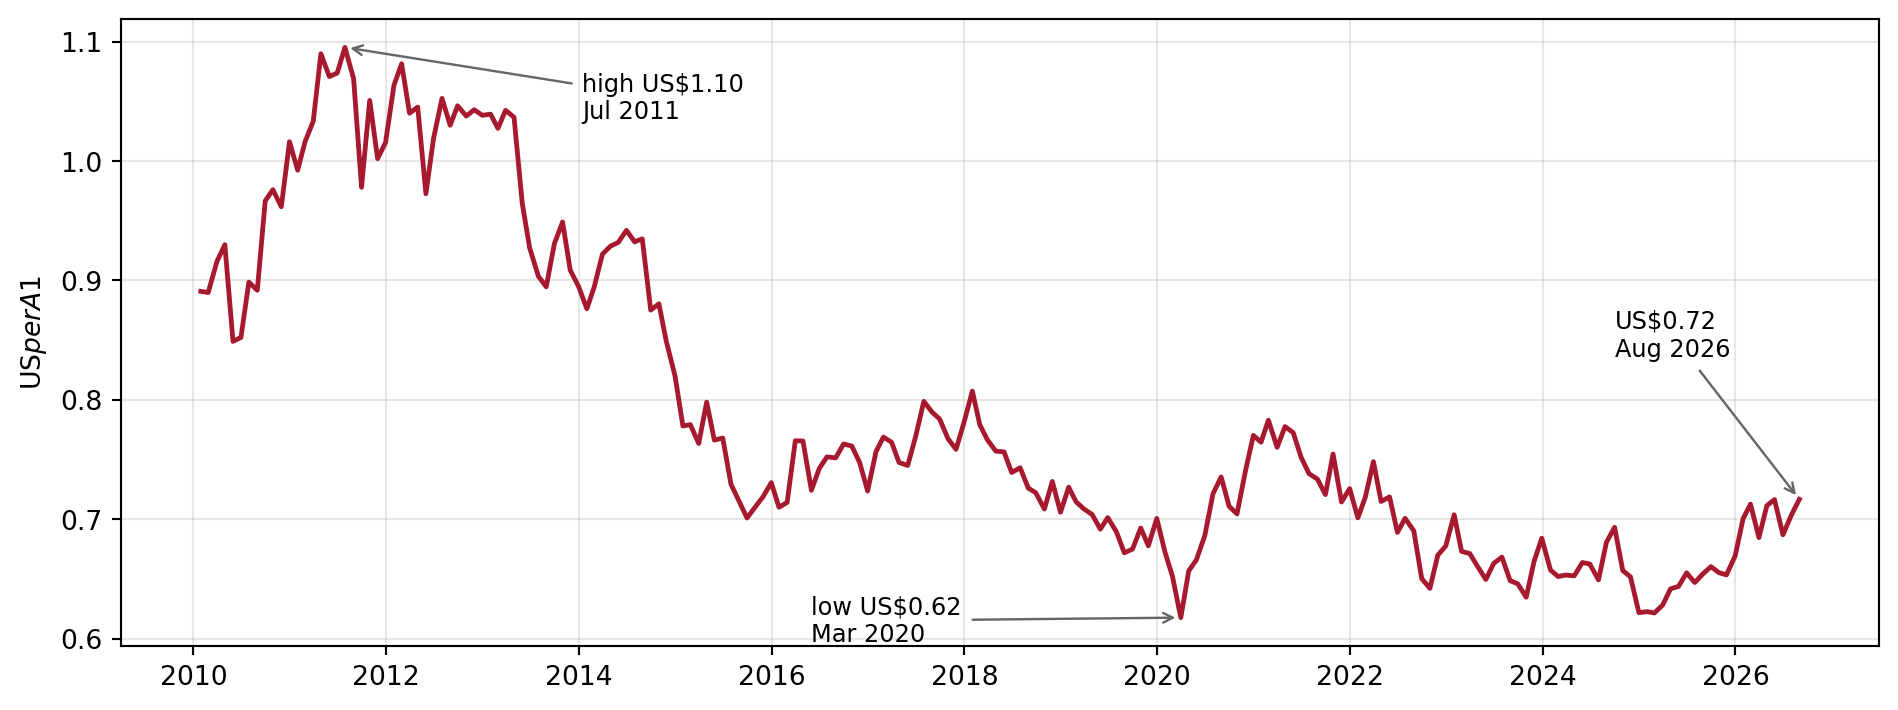
From its 2011 high to its 2020 low, the Australian dollar lost more than 40% against the US dollar.
Quick check
An Australian bank holds US-dollar loans. As the AUD falls, is it better or worse off in Australian dollars?
Better off. Each US dollar it is owed is now worth more Australian dollars. Holding US-dollar assets is a long US-dollar position.
Sources of FX exposure
\[ \text{Net exposure}_i = (\text{FX assets}_i - \text{FX liabilities}_i) + (\text{FX bought}_i - \text{FX sold}_i) \]
Only the net position matters. A bank with big foreign assets matched by equally big foreign liabilities has no FX risk in that currency.
Long or short
| Net exposure | Foreign currency strengthens | Foreign currency weakens |
|---|---|---|
| Positive: long | Gain | Loss |
| Negative: short | Loss | Gain |
| Zero: matched | No change | No change |
Example
An Australian FI is long NZ$1,000,000. The rate moves from NZ$1 = A$0.92 to NZ$1 = A$0.94, so the NZD has strengthened.
\[\text{NZ}\$1{,}000{,}000 \times (0.94 - 0.92) = \text{A}\$20{,}000 \text{ gain}\]
Had the FI been short NZ$1,000,000, the same move would be an A$20,000 loss.
Try it: long versus short
Code
Positive exposure is long, negative is short. A move of \(-8\%\) means the foreign currency weakened by 8%.
Code
pnl = expo * move / 100
line = Array.from({length: 41}, (_, i) => ({m: i - 20, v: expo * (i - 20) / 100}))

html`<div style="font-size:1.1em; margin-bottom:6px;">
  ${expo > 0 ? "Long" : expo < 0 ? "Short" : "Matched"} position:
  <b style="color:${pnl >= 0 ? '#1a7f37' : '#A6192E'}">${pnl >= 0 ? "gain" : "loss"} of A$${Math.abs(pnl).toFixed(1)}m</b>
</div>`
Code
Plot.plot({
  width: 620, height: 320, marginLeft: 55, marginBottom: 45,
  x: {label: "Move in the foreign currency (%)", domain: [-20, 20], grid: true},
  y: {label: "Gain / loss (A$m)", domain: [-20, 20], grid: true},
  marks: [
    Plot.ruleY([0], {stroke: "#999"}),
    Plot.ruleX([0], {stroke: "#999"}),
    Plot.line(line, {x: "m", y: "v", stroke: "#A6192E", strokeWidth: 2.5}),
    Plot.dot([{m: move, v: pnl}], {x: "m", y: "v", r: 7, fill: "#A6192E"})
  ]
})
A bad day for an FX position
The Week 5 idea, applied to currencies: daily earnings at risk (DEAR).
\[ \text{DEAR} = \text{Dollar value of position} \times 2.33\,\sigma \]
Example
An Australian FI holds €2.0 million, and €1 = A$1.25. The daily volatility of the exchange rate is \(\sigma = 0.5\%\).
- Value in A$: €2.0m \(\times\) 1.25 = A$2.5m
- 99% move: \(2.33 \times 0.005 = 1.165\%\)
- DEAR \(= \text{A}\$2{,}500{,}000 \times 0.01165 = \text{A}\$29{,}125\)
On 99% of days, the FI should lose no more than about A$29,000 on this position.
Inflation, interest rates and exchange rates
By the Fisher equation, a nominal interest rate is a real rate plus inflation:
\[ R = r + \pi \]
With free capital movement, real rates tend to equalise across countries (\(r_{AU} = r_{US}\)). Then
\[ R_{AU} - R_{US} = \pi_{AU} - \pi_{US} \]
The interest rate gap between two countries mirrors their inflation gap. Exchange rates sit between the two, through two parity conditions:
| Condition | Links exchange rates to | Explains |
|---|---|---|
| Purchasing power parity (PPP) | Inflation | Where the spot rate drifts over years |
| Interest rate parity (IRP) | Interest rates | The forward rate today |
Purchasing power parity
PPP rests on the law of one price: an identical good should cost the same everywhere, once prices are in the same currency.
| Candy in the US | Candy in Japan | Exchange rate at parity | |
|---|---|---|---|
| Before | US$1 | ¥100 | US$1 = ¥100 |
| After inflation in Japan | US$1 | ¥150 | US$1 = ¥150 |
At the old rate, US$1 buys only two-thirds of a candy in Japan. To restore the law of one price, the yen must depreciate to ¥150 per US dollar.
Tip
Higher inflation means a currency buys less, so it tends to depreciate. Price gaps drive trade, trade drives the demand for currencies, and demand moves the exchange rate.
Relative purchasing power parity
Over a year, the percentage change in the exchange rate is approximately the inflation gap between the two countries:
\[ \frac{\Delta S_{\text{¥}/\$}}{S_{\text{¥}/\$}} \approx \pi_{JP} - \pi_{US} \]
\(S_{\text{¥}/\$}\) is the number of yen per US dollar. It rises when the yen depreciates.
Example: the candy again
- Spot rate now: \(S_{\text{¥}/\$} = 100\), so the US$1 candy costs ¥100 in Japan.
- News comes in: inflation over the year was 5% in Japan and 2% in the US. The candy now costs ¥105 in Japan and US$1.02 in the US.
- Relative PPP says the exchange rate adjusts by the inflation gap:
\[ \frac{\Delta S_{\text{¥}/\$}}{100} \approx 0.05 - 0.02 = 0.03 \quad\Longrightarrow\quad \Delta S_{\text{¥}/\$} \approx 3 \]
The rate moves to about ¥103 per US dollar, so the yen depreciates by about 3%. Check with the candy: ¥105 / US$1.02 \(\approx\) ¥103, so it costs the same in both countries again.
Purchasing power parity in practice
PPP holds only roughly, and slowly.
- Tradable goods come closest, because trade can close a price gap.
- Non-tradables such as housing, haircuts and healthcare can stay apart for decades.
The Big Mac Index
The Economist has compared Big Mac prices across countries since 1986. If a Big Mac costs A$8 in Sydney and US$5 in New York, PPP implies A$1 = US$0.625. Market exchange rates routinely sit far from the Big Mac rate, even for an identical burger.
Interest rate parity
Two risk-free ways to invest A$1 for one year must pay the same. Otherwise there is a free profit.
Blue boxes are in Australian dollars, pink boxes in euros. \(S = S_{AUD/EUR}\) and \(F = F_{AUD/EUR}\) are the spot and forward rates in Australian dollars per euro. Because \(F\) is agreed today, Strategy 2 carries no currency risk: this is covered interest rate parity.
The interest rate parity condition
Setting the two payoffs equal:
\[ 1 + r_d = \frac{(1 + r_f)\,F_{AUD/EUR}}{S_{AUD/EUR}} \quad\Longleftrightarrow\quad F_{AUD/EUR} = S_{AUD/EUR} \times \frac{1 + r_{AUD}}{1 + r_{EUR}} \]
- If the Australian rate is higher (\(r_{AUD} > r_{EUR}\)), the euro trades at a forward premium (\(F_{AUD/EUR} > S_{AUD/EUR}\)). The premium compensates an Australian investor for the lower interest earned in euros.
- Put the other way, the high-interest currency trades at a forward discount.
- A forward rate is not a forecast. It is pinned by today’s interest rates, which is what lets a bank lock in a rate and hedge.
Interest rate parity: a worked example
The Australian interest rate is \(r_d = 5\%\), the euro rate is \(r_f = 10\%\), and today €1 = A$0.60, so \(S_{AUD/EUR} = 0.60\). What is the one-year forward rate? If the spot rate rises to \(S'_{AUD/EUR} = 0.65\), how much does the forward rate change?
Step 1: forward rate today
\[ F_{AUD/EUR} = 0.60 \times \frac{1.05}{1.10} \approx 0.5727 \]
The forward is €1 = A$0.5727, below spot: the higher-interest euro trades at a forward discount.
Step 2: forward rate after the spot rate rises
\[ F'_{AUD/EUR} = 0.65 \times \frac{1.05}{1.10} \approx 0.6205 \]
Step 3: the change
\[ \Delta F_{AUD/EUR} = \Delta S_{AUD/EUR} \times \frac{1.05}{1.10} = 0.05 \times \frac{1.05}{1.10} \approx 0.0477 \]
The forward rate moves in proportion to the spot rate.
Interest rate parity in real data
IRP predicts that sterling’s forward premium against the US dollar, per year, matches the gap between US and UK interest rates:
\[ \frac{F_{USD/GBP} - S_{USD/GBP}}{S_{USD/GBP}} \approx r_{USD} - r_{GBP} \]
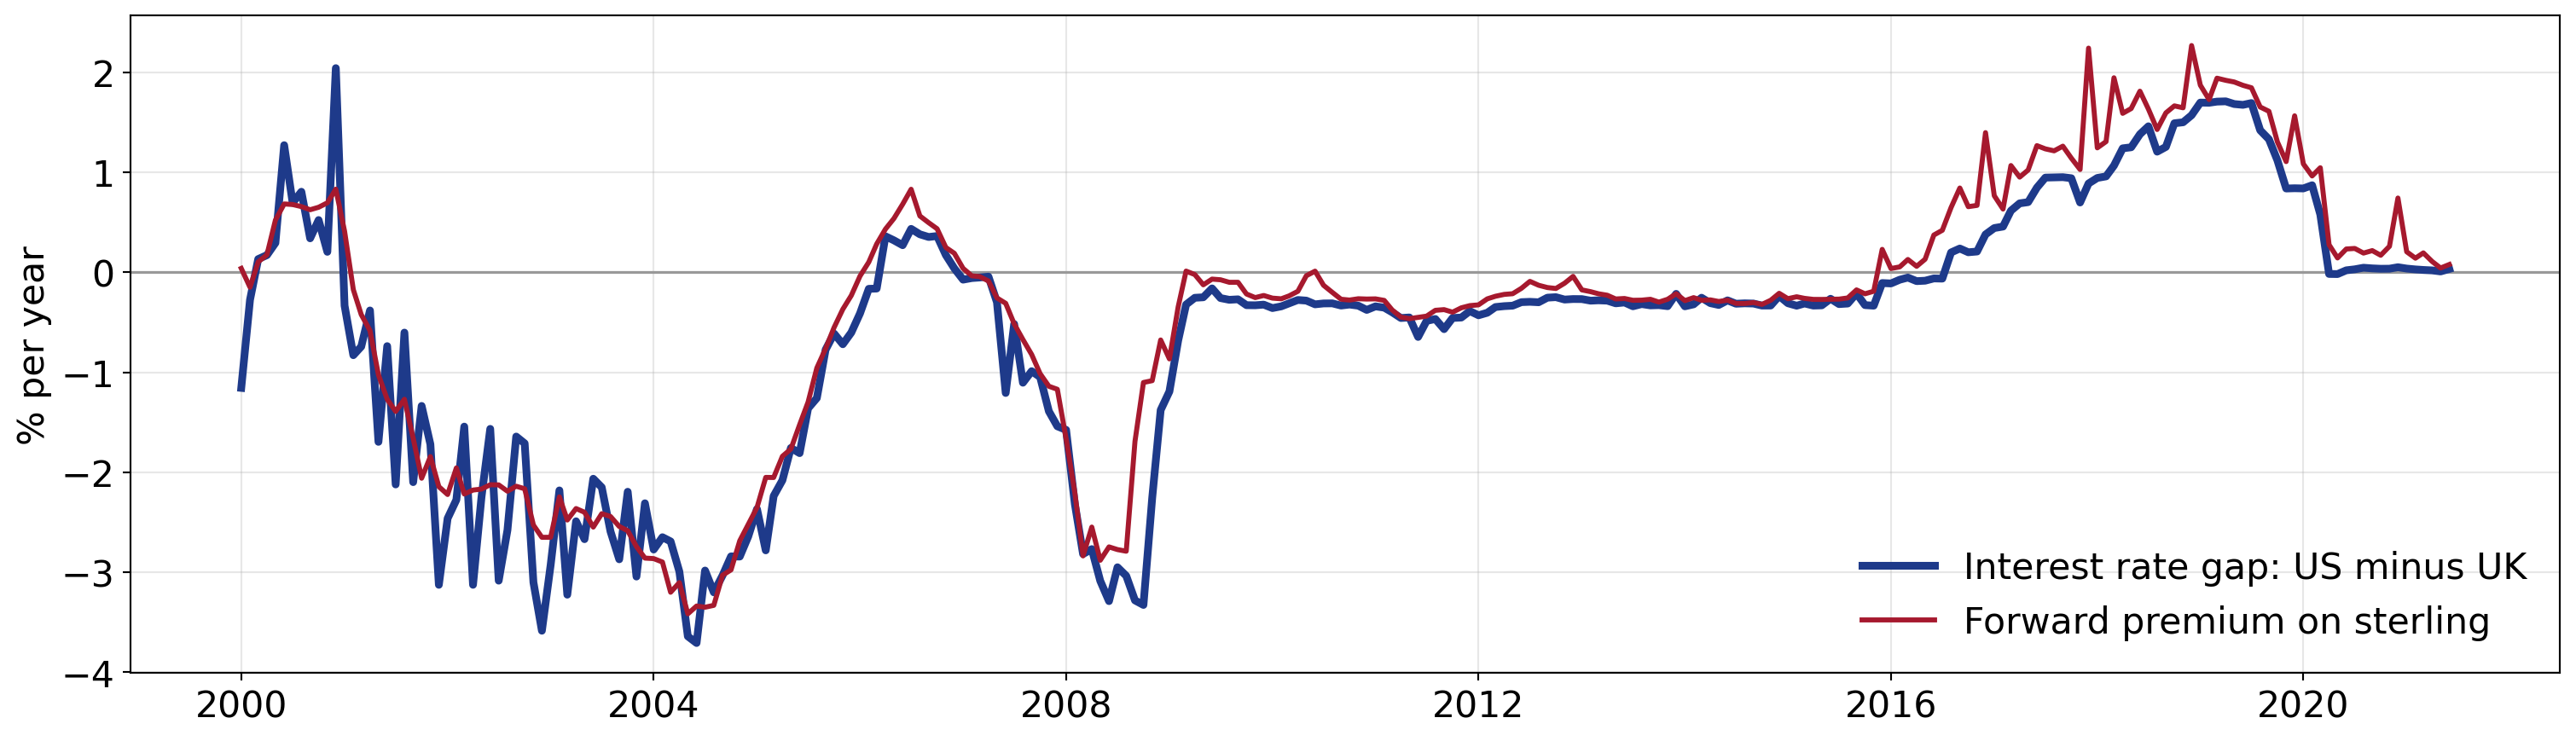
The two lines track each other closely: sterling trades at a forward discount when US rates are below UK rates, and at a premium when they are above. Gaps open in stress, such as late 2008, when banks scrambled for US dollars.
Managing FX risk
Hedging is not free insurance
On 15 January 2015 the Swiss National Bank abandoned its 1.20 EUR/CHF floor without warning, and the franc jumped about 30% against the euro within minutes. Stop-loss orders could not execute at their set prices; a UK FX broker became insolvent and the largest US retail FX broker needed a US$300 million rescue.
Australian banks: borrow offshore, swap back
Recall Week 9’s wholesale funding: Australian banks raise a significant share of their funding by issuing bonds offshore, in foreign currencies. They hedge the currency risk with a cross-currency swap.
Over the life of the bond, the bank pays Australian dollars to the swap dealer and receives the US dollars it owes investors. It ends up with Australian-dollar funding, so a move in the AUD barely touches its balance sheet.
Important
The FX risk has not vanished. It has been swapped for counterparty risk, carried by a contract that sits off the balance sheet. That is Part 3.
Sovereign risk
A government can stop a healthy borrower paying
The block can be capital controls, a foreign currency shortage, or sanctions.
- Credit risk: the borrower cannot or will not pay. Lenders can go to court in the borrower’s country.
- Sovereign risk: the government stops the payment, however healthy the borrower. There is no global court to enforce repayment against a state.
So lending abroad needs two checks: the borrower, then the country.
Repudiation or restructuring
| Repudiation | Restructuring | |
|---|---|---|
| What happens | The country cancels its foreign debt outright | The terms change: longer maturity, lower interest, smaller principal |
| How common | Rare, and mostly before World War II | The most common form today |
Greece’s 2012 restructuring cut private bondholders’ claims by 53.5%, reducing its debt by about €100 billion.
Restructuring took over because post-war lending came from banks rather than scattered bondholders, which made renegotiation easier. Neither is the same as debt forgiveness agreed by creditors, as under the IMF and World Bank HIPC Initiative, which has provided relief to 37 countries.
Argentina: nine defaults and counting
1827, 1890, 1951, 1956, 1982, 1989, 2001, 2014 and 2020. The 2001 default, on about US$82 billion owed to private creditors, was the largest in history at the time.
Scoring country risk
Banks use outside ratings (Euromoney, Institutional Investor, OECD) or build their own score from economic ratios.
| Ratio | Formula | A higher value means |
|---|---|---|
| Debt service ratio (TDSR) | (interest + principal repaid) / exports | more risk |
| Import ratio (IR) | imports / FX reserves | more risk |
| Investment ratio (INVR) | real investment / GDP | less risk, arguably |
| Export revenue variance (VAREX) | variance of export revenue | more risk |
| Money supply growth (MG) | change in money supply / money supply | more risk |
The logic is simple: exports earn the foreign currency; imports and debt payments spend it. A score combines the ratios into a probability of restructuring,
\[p = f(\text{TDSR}, \text{IR}, \text{INVR}, \text{VAREX}, \text{MG}, \dots)\]
Off-balance-sheet risk
Promises that live in the footnotes
OBS items are contingent: nothing on the balance sheet today, a real asset or liability if a trigger event happens.
Banks like them because they earn fees without using the balance sheet today. Historically that also meant less capital, fewer reserve requirements and lower deposit insurance costs.
Enron
Enron used hundreds of special purpose entities to keep billions of dollars of debt off its balance sheet. When they unwound in late 2001 it collapsed within weeks.
Five kinds of OBS exposure
| Activity | The promise | It goes wrong when |
|---|---|---|
| Loan commitment | Lend up to a limit, later | Borrowers all draw at the worst moment |
| Letter of credit | Pay if the client does not | The client fails to perform |
| Derivative | Exchange cash flows in future | Markets move, or the counterparty defaults |
| When-issued trading | Deliver securities not yet issued | The bank’s allocation falls short |
| Loan sold with recourse | Take the loan back if it sours | The loan’s quality deteriorates |
Loan commitments
A promise to lend up to a set amount, at a set rate, whenever the borrower asks.
Example
A one-year $10 million commitment, upfront fee 1/8%, back-end fee 1/4%. The firm draws $8 million.
- Upfront fee: \(\$10{,}000{,}000 \times 0.125\% = \$12{,}500\)
- Back-end fee: \(\$2{,}000{,}000 \times 0.25\% = \$5{,}000\)
The back-end fee pays the bank for keeping liquidity ready that the borrower did not use.
Pricing a loan commitment
The Week 6 promised return, adjusted for the fact that only part of the commitment is drawn. You will use this in Workshop 10.
- Base rate \(BR=12\%\)
- Risk premium \(\phi=2\%\)
- Upfront fee \(f_1=1/8\%\)
- Back-end fee \(f_2=1/4\%\)
- Compensating balance \(b=10\%\)
- Reserve requirement \(RR=10\%\)
- Expected takedown \(td=75\%\)
\[ \begin{aligned} 1+k &= 1+ \frac{f_1+f_2(1-td) + (BR+\phi)\, td}{td - b\times td\, (1-RR)} \\ &= 1+ \frac{0.00125+0.0025(0.25) + (0.14)(0.75)}{0.75 - 0.1\times 0.75 \times 0.9} \\ &= 1.1566 \end{aligned} \]
So \(k=15.66\%\).
- Numerator: everything the bank earns.
- Denominator: the money it actually has to put up.
The risks in a loan commitment
| Risk | The problem |
|---|---|
| Interest rate | A fixed-rate commitment loses value if rates rise |
| Drawdown | The bank cannot know when, or how much, will be drawn |
| Credit | The borrower’s quality can fall before it draws |
| Aggregate funding | In a crisis, everyone draws at once |
Important
In March 2020, as COVID-19 hit, companies drew on their credit lines at the same time. The drawdown risk every bank had priced separately arrived all together. This is why the Week 8 LCR assumes part of every undrawn commitment is drawn in a stress.
Letters of credit
A bank promises to pay on its client’s behalf.
- Commercial (documentary) LC: backs trade, as above.
- Standby LC: pays if the client fails an obligation, such as repaying commercial paper. It covers contingencies that are less predictable and potentially more severe.
Letters of credit in 2008
- In the GFC, many US firms could not roll over maturing commercial paper (CP).
- Their defaults would have triggered the standby letters of credit that banks had written to back that CP.
- In October 2008 the Federal Reserve launched the Commercial Paper Funding Facility, buying commercial paper through its primary dealers.
- By supporting the CP market, it kept those letters of credit from being drawn.
Tip
A bank’s true risk in a crisis includes its OBS guarantees. The balance sheet does not show them, but stress reaches them first.
Derivatives
- Users hedge their own risks, like the Australian bank’s cross-currency swap.
- Dealers take the other side for a fee. The major Australian banks act as both.
| Contract | Counterparty risk |
|---|---|
| Exchange-traded futures and options | Low: a clearing house stands between the parties |
| Forwards and swaps | Real: the other side may not pay |
AIG, 2008
AIG had written hundreds of billions of dollars of credit default swaps. When they turned against it, it could not meet the collateral calls, and the US government committed up to US$182 billion to rescue it.
When-issued trading and loans sold
When-issued trading
Banks bidding at an Australian Office of Financial Management (AOFM) tender for Australian Treasury Notes can sell their expected allocation forward, before the securities exist.
Risk: over-commitment. If the bank is allocated less than it sold, it must buy the gap in the market, possibly at a loss.
Loans sold
A bank makes a loan, then sells it to another investor.
- No recourse: the buyer bears all the default risk.
- With recourse: the buyer can hand the loan back if it sours, so the seller keeps a hidden credit risk.
OBS can reduce risk too
- Many OBS positions are hedges, like the cross-currency swap in Part 1.
- They are a large source of fee income, especially for the biggest banks.
- The danger is the asymmetry: small fees in calm years, large payouts in a crisis.
One sentence to remember
The balance sheet shows what a bank looks like today. Its off-balance-sheet positions show what it could look like tomorrow.
Finally…
Key takeaways
- FX risk comes from the net position. Long gains when the foreign currency strengthens; short gains when it weakens.
- Parity conditions link currencies to inflation (PPP, loosely and slowly) and to interest rates (IRP, which pins the forward rate and makes hedging possible).
- Hedging FX risk usually creates OBS exposure. Australian banks swap offshore funding back into AUD, trading currency risk for counterparty risk.
- Sovereign risk is not credit risk. A healthy borrower can still fail to pay if its government stops the payment.
- OBS items are promises. Loan commitments, letters of credit, derivatives and recourse sales cost little in calm years and can dominate a bank’s risk in a crisis.
AFIN8003 Banking and Financial Intermediation